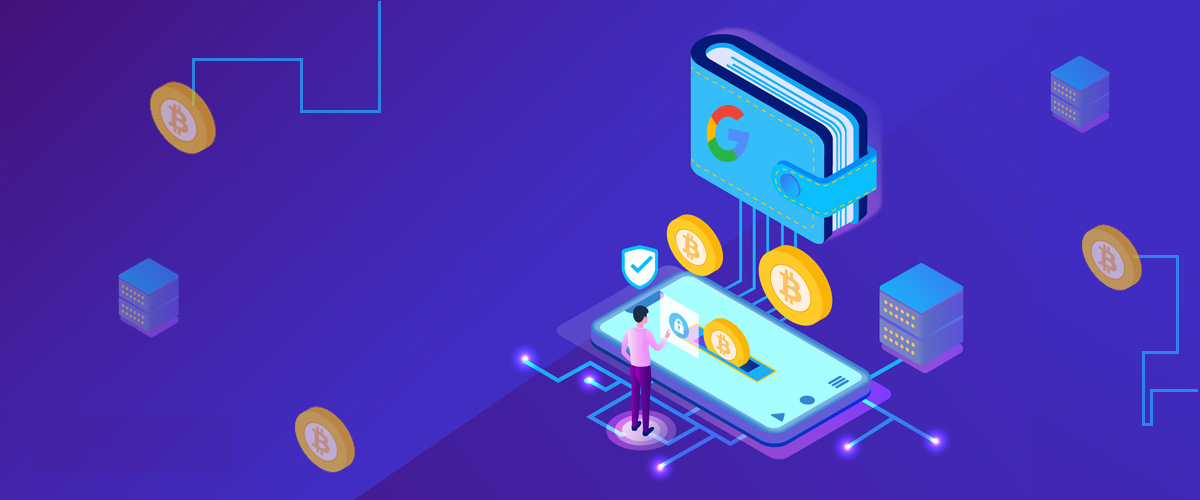
Buy bitcoins with google wallet (google pay)

Google Pay is one of the most popular online payment methods globally, which is developing online, and many online sellers also accept this payment method.

Google Pay is one of the most popular online payment methods globally, which is developing online, and many online sellers also accept this payment method. Is it possible to buy cryptocurrency with Google Pay?

Many reputable cryptocurrency exchanges now support Google Pay, and you can easily buy and sell bitcoins with Google Pay. But in the following, we will introduce the best way to buy and sell cryptocurrencies through Google Pay.

How to buy cryptocurrencies with Google Pay

Countless exchanges support the Google Pay method. CoinKong, Binance, and LongHorn, for example, are among the platforms where you can buy and sell different cryptocurrencies for a lower transaction fee.

What is a Google Pay digital currency trading platform?

One of the most attractive platforms in the digital currency markets is the Google Pay Bitcoin broker, which allows you to buy and sell digital currencies while supporting Google Pay payments. More broadly, a Bitcoin broker is a platform that acts as an intermediary between transactions between coins for you. If you have connected your credit or debit card to Google Pay, a Google Pay broker can deposit money into your account faster and easier.

How to deposit and withdraw via Google Pay?

Deposit

Bitcoin brokers and exchange offices offer different ways to deposit. However, there is a general trend in each deposit that can be divided into the following steps:

  1.       You must first create an account and authenticate it using the photo ID form.
  2.       Go to your broker’s website and then select the Google Pay option on the Add money page.
  3.       You will then be allowed to connect your Google Pay account to your broker account.
  4.       Enter the desired bitcoin amount and then select Google Pay to pay to enter the payment page.

Withdraw

You have two options for withdrawing. If you have previously used Google Pay to make a deposit, you can click on withdraw on the website to complete the transaction faster. If you have not used the Google Pay option, you must select a withdraw method based on the methods mentioned above.

What features should every bitcoin broker have?

To choose a broker as a digital currency trading service, you must pay attention to the quality of the service and its capabilities and facilities. However, there are many standards for choosing a broker that we describe below:

Deposit and withdrawal costs should be as low as possible. When doing digital currency trading, you pay a separate fee to buy Cryptocurrencies or even withdraw at each broker. You should pay attention to choosing a broker that has the lowest amount of withdrawals or deposits.

The speed of a broker in performing the transaction is also very effective in choosing it as your cryptocurrency broker. A platform must be able to buy and sell or pay as quickly as possible.

Brokers are more successful if they are easy to use. You should never spend your time with brokers that have fewer features and are harder to use. The best option is the simplest option.

Check and see what views the broker you choose has. From the users’ point of view, is this platform reliable or not? The more positive feedback there is, the better the choice!

Trading platforms must have worked in the market for a long time. Therefore, the amount of time to build the platform can also be an option to determine the quality.

Advantages and disadvantages of buying and selling a digital currency with Google Pay

Pros

The speed of buying and selling and simplicity with this method is very high, and it is one of the most convenient payment systems in the world.

Many banking portals support Google Pay, and many financial institutions around the world approve of this payment method. So you can make a variety of payments at once with a credit card.

Increasingly, from 2019, cryptocurrency trading platforms will accept Google Pay and allow users to pay from such a system. So Google Pay has become one of the most widely used payment services right now.

Cons

Of course, its disadvantages include non-acceptance in all countries. If such a payment system is not accepted in your country, it is better to choose other alternative methods.

The security of this application is high, but its transactions are traceable and are done under the supervision of the US banking system.

Do you need a digital wallet to buy and sell cryptocurrencies with Google Pay?

It’s not always like this. Online brokers do the trading themselves and allow you to buy and sell without depositing in your wallet. However, some services will ask you for the wallet address to send the coins to that address.

Now it is better to use Cold or hardware wallets like Trezor or Ledger instead of software wallets.

Conclusion

Google Pay is one of the best and easiest ways to buy and sell cryptocurrencies in exchanges and digital currency trading platforms. Many of these services now accept payment with Google Pay and allow you to receive an order in different currencies. What do you think about this payment method? Have you ever used it?
The W pattern trading and its specifications

The w pattern is one of the technical analyzes based on the graph pattern that shows trend changes or momentum reversal with price action priority.

The w pattern or double bottom pattern is one of the technical analyzes based on the graph pattern that shows trend changes or momentum reversal with price action priority. This pattern represents a decline in assets in digital currency or other financial markets, a rebound, and then a kind of decline exactly like the decline that occurred at the beginning of the pattern. This graph is similar to the letter W, which takes two drops at a certain distance.

W or double bottom pattern

The double bottom technical analysis chart, or W, shows an initial drop with a 10 to 20% price reduction. The second drop in this chart will be 3 to 4 percent less than the initial drop, after which the trading volume will increase.

Like other chart patterns, a W or double bottom pattern is the best option for analyzing digital currency markets based on medium and long-term maps. The greater the distance between the two drops in the chart, the greater the probability of success and completion. It takes at least three months for a complete double bottom chart to form ultimately. If such a time frame is available, the probability of success of the W model can be considered close to 90%. So when you want to do chart analysis on this template, use weekly or daily price data. Recognizing the pattern at shorter intervals can drastically reduce its success rate.

The W pattern always occurs after a negative trend in a certain period, and after the formation of this pattern, we will most likely see a positive routine. This pattern must be approved based on market fundamentals. It shows the characteristics of a kind of reversal in the market trend. However, the volume of transactions should also be checked frequently. A sudden upward change in market volume can occur after both positive price trends in the chart. These changes are significant indicators in determining the positive trend pressure and confirming the formation of the W pattern.

When the price closes in the second rebound and reaches the highest level of the first rebound in the pattern and the upward changes in trading volume are confirmed by the stabilization of the market mode index fundamentals, you should immediately open a long position. This position should equal the price level of the first rebound, and a stop loss should be created in the second low chart. The profit target should also be twice higher than the initial price before the stop loss.

The Difference Between a Double Bottom and a Double Top

The double top diagrams have precisely the opposite W procedure. A double top pattern is formed with two positive peaks. The first vertex creates a graph similar to an inverted U. Rounded peaks can indicate a bearish market return and start when the bullish market pressure has just ended. If a double top pattern is formed, the second rounded peak is probably lower than the first because the second peak faces resistance to price increases. Double top patterns are rare because, in this case, investors are looking for the ultimate goal after a bullish trend. At the end of each double top pattern in the digital currency market, we see a bearish reversal that traders can profit by selling their digital currency in a negative trend.

Double Bottoms problems

The W graph pattern, like other patterns, can be very effective if detected accurately. However, if you misidentify the pattern, you will see a lot of damage. Therefore, when recognizing the pattern, you should keep in mind all the tips and specifications so that you do not fall into a trading trap.

How to identify a W pattern?

In general, there is a way to identify the W pattern, which can be expressed as follows:

  • First, measure the width and height of both bottoms.
  • The distance between the two bottoms should not be too small and should be checked over a considerable period.
  • Measure the resistance level and confirm its pricing.
  • Using oscillators and moving averages, which are auxiliary indicators of financial markets, you can use the W chart as the final confirmation of technical analysis.
  • Be wary of robust trends.

Trading with a double bottom pattern in the crypto market

The W chart or double bottom pattern is used in most financial markets, including cryptocurrencies, and is useful for opening medium to long-term positions. Entering any trade involves waiting for confirmation of the candle close to the bottleneck. This method slightly increases the risk but also increases the probability of success in the transaction.

The exact formation of the W pattern depends on the time frames

Most technical analysis technicians believe that the first bottom should include a 10 to 20 percent price reduction. The second bottom should be 3 to 4 percent less than the first. The next leading trading volume should also increase.

Just like other technical analysis models, the W model is used to analyze medium to long-term situations. As we said, the distance between the two drops in the chart should be significant to increase the probability of success.
Method of trading with W pattern

The double bottom or W pattern indicates a seller’s exhaustion. When salespeople get tired, a reversal trend sets in. This strategy can also make it easier for you to target profitability accurately.

However, it is difficult to use this method by trading in tops and bottoms patterns. In pattern W, you have to wait for the final pattern to form in the long run. There are three main points for traders:

  • See a bearish trend
  • See two almost identical bottoms in the middle of a resistance point.
  • See a breakout bottleneck.

Identify the market phase

We must first identify the market phase for the pattern. We do this because the W pattern needs a downtrend. By reverse detection, the time to enter different stages of the transaction can be found. So the first option is to detect the phase or state of the market. At any given time, the market can move up, down, or even sideways.

Find the historical precedent or chart pattern.

You do not have to decide or set a target for the transaction without confirming the price line. To be able to work with the pattern more so, you need to see both rounded bottoms. In technical analysis, a round bottom is a price that is formed after the downtrend. Prices go down and then move in the opposite direction with a circular screw.

Allow only a tiny variation between both bottoms.

Never look for a perfect chart. You have to give up your idealism on an excellent deal because you may never get the best W pattern you have in mind. So be flexible. In this case, look for a slight change between the two bottoms.

Purchase when it closes above the neckline

Once the market and pattern phase is complete, you should wait for confirmation and see the momentum change. The indicator here is the breakout candle, so buy when the price is slightly above the bottleneck.

Place a stop-loss

Place a stop-loss line just below the support formed by the reversal pattern W. You should also be able to identify subsequent risks with a W pattern. If you have a stop-loss, you will no longer have to worry about severe losses and the loss of all your assets.

Conclusion

In digital currency markets, due to the many fluctuations, it is complicated to distinguish a W or double bottom pattern in short periods. So we suggest that you place this pattern for more significant impact in periods of 1 to 6 months so that you can make the most profit.

What is RSI divergence and how to use it?

So far, we have shown how RSI divergence as a trading routine can increase your profitability and increase trading efficiency.

Using divergence, you can find key trading positions. But how to use RSI divergence, and what are its uses in any trading?

RSI divergence occurs precisely when the Relative Strength Index indicator returns before the price. A bearish divergence involves over-buying the RSI after a low is within it. At the same time, asset prices should reach their highest level in the second peak if the RSI is lower. There is also an oversold position in the RSI in a bullish divergence. It appears after a lower minimum in the RSI chart. At the same time, the price must be less than the minimum.

Here are some examples of RSI divergence and see how you can make the most of such situations.

The RSI Divergence

Another usage of RSI divergence is to display the rate of change in price shocks exactly when you see a difference in the asset’s price. RSI divergence can also be used as a short-term signal, with investors using it to predict price returns.

Different approaches in RSI divergence

Graphically, showing RSI divergence is a bit difficult, but examples can be implemented to understand RSI divergence in Bearish and Bullish modes.

Bearish Divergence

The chart below shows a bearish divergence, the price finds two new highs, but the RSI reaches two highs.

This pattern indicates that positive shocks are slowly returning, and a downward trend is imminent.

One of the things mentioned in this case is that two divergences can be a buy or sell signal. In the first divergence, you have to start the deal. In the second divergence, you have to make a deal so as not to lose money.

So when your analysis of trade was fixed, reopen the position.

Bullish Divergence

As the name implies, bullish divergence is precisely the opposite of bearish divergence.

First, look for a buy signal in the RSI.

Then look for the lowest in price changes and the highest minimum in RSI. The signal does not have to be in the oversold range to confirm the signal.

RSI divergence confirmed

The first thing to check is that you can’t answer every signal positively and achieve profitability.

Most investors and traders who have just entered the market think that any signal can make them profitable.

Of course, such a thing is not possible. Every trade wins and loses.

However, it is best to do everything you can to make your divergence signal effective.

Fortunately, few variables lead entirely to the profitability of a divergence signal.

The first thing to look for alongside RSI divergence is whether the RSI is in a sell position or a buy position. This shows that the sudden rapid movements of the price will push it back with the same intensity.

In this case, you should look for the following situations:

  • Oversold: The price has the lowest level, but the RSI reaches the highest level.
  • Overbought: The price of one is the highest, but RSI is the lowest.

Also, keep in mind that the candle must reach its nearest state to confirm the RSI divergence signal.

Never trade before closing the candle and receiving confirmed divergence.

The best general settings for divergence

Just like other indicator-based trading strategies, the specific RSI settings are different for each trader. However, a default setting for RSI can be suggested:

  • 14 period
  • 30/70 signal levels

Optimization of trading methods based on RSI divergence

Now that you know what RSI divergence is and how it works, we need to show you how to optimize your trading strategies and make more profit. These methods can increase the amount of reward earned from each transaction.

Use Support and Resistance

You can increase your chances of winning trades by following RSI divergence’s support and resistance points.

The key is to look for solid points of resistance and support.

This is precisely where you can find an adequate signal. Check how much you need to follow to get to the support point.

Trailing Exit

Another function that increases the profitability of any trade with the RSI divergence strategy is to look for your Stop loss.

Just like other trading methods, changing the exit method has its advantages and disadvantages. When you use a trailing exit, your chances of winning the trade are likely to decrease.

If you want to look cheerful, trailing Stop loss can increase the overall profit from the transaction. You can also program your outputs automatically using robots and other algorithms.

One of the most commonly used methods is Parabolic SAR. This index places dots at the top or bottom of each candle so you can find the exit points.

For example, in a long trade, you can place a stop loss on one or two levels of PSAR before the current candle.

If you do not want to use the PSAR indicator, another way to implement a trail stop loss is to move to the next resistance or support point.

By trailing the stop loss on each blue line, you can profit by moving the price towards the target. This move could be more profitable than targeting 1R to the next level of support.

Fixed Profit Targets

If the uncertainty of the trailed profit targets does not work for you, or you do not want to use the resistance and support levels, you can choose fixed profit targets.

The best time to start fixed targets is to set orders on different levels of risk.

Example If you use 1x risk or 1R as a profit target, you can set a fixed profit target. So if your stop-loss is set to 100 pips, you can get a profit of the same 100 pips.

If you want to automate the targeting of the trailing stop, you can use the MetaTrader tool to do this to get the best profit.

This method is effective if your previous predictions about the price are correct, but suddenly the price has sudden movements contrary to your expectations.

Each platform offers different charts for analysis that you can use this type of strategy using the amount of profit and loss or risk limit drawn on the charts.

Do Divergence Strategies Fail?

Just like other trading methods, divergence is not always 100% certain.

In trend markets, the divergence trading strategy is likely to fail. If you do a lot of divergence trading on strong trends, you lose a lot of money.

So try to have significant risk and profit management before starting this method.

Try to identify trends before you start trading to avoid problems when implementing the strategy.

Also, the success rate of the transaction is adjusted based on your exit strategy and the execution quality. The ability to analyze the result is also involved.

General reasons for failure in trading strategies include the following.

  • Not enough testing
  • Giving up too early
  • Not journaling your trades properly
  • The strategy doesn’t have an edge
  • Unrealistic expectations
  • Not knowing your expected statistics
  • Missing good trading opportunities

These problems always exist for all methods. However, you should choose strategies with a kind of exit time forecast to have the most negligible losses.

If after a few wins, once you lose, do not change the strategy. It may not be a problem of trading strategy.

Conclusion

So far, we have shown how RSI divergence as a trading routine can increase your profitability and increase trading efficiency.

Keep in mind that divergences may work well in some examples, but you have to experience and learn from them to use them in the best way and at best possible time to determine the entry and exit points.

You can start with complicated trading plans and backtesting. Then review the strategy and start trading usually. Use these methods to spend time in the market and analyze the result. You also need to adjust the exit points to control the amount of damage in the strategy.

Bearish flag pattern

A bearish flag is a technical pattern that signals that the current trend will potentially be continued. The bearish trend follows a downtrend.

The flag pattern is used by technical analysts and traders and it signals the continuation of the current trend. In this article, we’re going to learn about the bearish flag, and we’ll cover what it is, who to find one, what it tells us and how we are supposed to use them in our trades and our analysis. So, let’s waste no more time and get to it.

What is a Bearish Flag?

A bearish flag is a technical pattern that signals that the current trend will potentially be continued. The bearish trend follows a downtrend, so after a drop in an individual security’s price comes a consolidation phase in which price moves inside a channel called “flag” (also called the consolidation channel) where the price can rest for a little bit of time. The consolidation channel is directed upwards and the price may also retrace and go back to the lost levels.

After the consolidation channel, the price continues the trend and starts dropping again. The first downward movement before the price enters the consolidation phase is called the “flag pole”.

How to identify a Bearish Flag?

Identifying a bearish flag isn’t a hard thing to do. To learn to identify them easily you should learn about their different components and understand them. After that, you should train your eyes by looking at different security’s charts and try finding different bearish flags. By doing so, you’ll guarantee that you’ll know a bearish flag the next time you see one on a chart.

The bearish flag pattern is made out of 3 main components:

I.The first component is the flag pole, that’s what you should be looking for in the first place if you’re going to find a bearish flag pattern. The flagpole is the first downtrend which is the initial movement of the bearish flag pattern. The downtrend can be very steep and the security’s price can drop down fast, or it could be more like a slow drop down and the security’s price may go down with a low slope and it could take some time to drop down in the price of the security. But no matter how fast or slow the downtrend completes, either way,  it’s still called a flag pole.

  1. The second component is called the “flag”. This is the phase where the price just stays and just consolidates in a channel. During this period the channel could also be moving upwards. This means although the price could retrace to some of the lost levels and break out of some resistance level near the current number. But it has a limit and if you connect the highs and the lows of the price action in this phase you could find the consolidation channel the price is resting in currently. You should remember that the price could rise (slightly) and shouldn’t be mistaken with a reversal. The consolidation could be upwards or even downwards. You should wait until this period is over and the price breaks out of the bottom of the channel, or even from the top, in that case, you should find out if it’s a fake breakout or not.
  1. After the price broke out of the channel, you can expect to see another bearish leg. Under these circumstances, you can open a short position and gain profits from the downtrend the price is currently in. You should also place your “take profit” to make sure we won’t miss on the potential gain. And remember, we don’t need to gain all the profits that the market could potentially offer. We can’t earn money from every swing, we just need to take our piece and move on to the next possible scenarios. To measure the price to put our take profit order at, you should measure the first bearish trend in which price dropped, the flag pole. So to measure a trend you need 2 points to draw a line. The first point is where the first drop-down happens, the first candle that started the downtrend (the flag pole), the second point is the ending candle in the flag pole. The last candle that caused the price to drop, before the price went into the consolidation phase. For example;

Let’s call the beginning point of the flagpole point A and the last point of the flagpole point B. If the difference between point A and point B (for example) is 15%, after the consolidation channel where the price breaks out of the support, you can expect another 15% drop in price. So you can place the order at 14.5% to be sure, if you also find a historical support level at that level (by historical means if the price has picked a support at that level before), there’s a great chance that the price will be supported at that same level again so you could take your profit at a slightly rounded up price just to be sure.

An example of a Bearish Flag

Here you can see a bearish flag pattern happening in the bitcoin 1H time frame chart. At a price roughly above 66000 where it performed a fake breakout (also known as a fake-out) it got rejected by the resistance and started moving downward which formed the flagpole, it’s marked by the red line. Price then entered the consolidation channel (you could also draw a smaller channel there) and started moving upwards and after dropping to 62000 it was able to reach back to 64000, where it broke out of the consolidation channel and went back to continue the downtrend. Then in the trend marked by the orange line, the price dropped from 64000 to 61000 and completed that bearish swing.

How can we trade a bearish flag pattern?

In the picture mentioned in the previous section, after seeing the flagpole you should wait for price action to enter the consolidation channel and watch the market sentiments at that price and observe to see if a consolidation channel is being formed or not.

If the price entered a consolidation channel and you made sure there’s no reversal happening, wait for the price to break the consolidation channel, there you can place you take profit orders based on your strategy and your stop loss should be slightly above the last high before the price broke out of the channel. Remember that your targets for taking profits should at least be as twice as the stop loss.

Which cryptocurrency will be profitable to mine in 2023?

For those who feel like embarking on a mining journey all by themselves, Ravencoin is a matching option. All you should know on Inosocial articles.

Bitcoin is the most famous and the oldest cryptocurrency built on the basis of a proof-of-work algorithm. Satoshi Nakamoto wanted to drive the value of the coin by limiting the ability to get Bitcoins at your will. Conversely, there is only a strict timeframe of roughly ten minutes in which a certain portion of new Bitcoins can be mined and there’s no other way around it. And the more difficult it is to mine Bitcoins the more the people tend to want them. Competition builds up and every consecutive year it becomes harder and harder financially to squeeze in because the equipment for such tasks should be extremely powerful and hence, expensive.

So, is there any other way to become a miner if you are not filthy rich and don’t possess a hefty investment? Turns out that yes, there is a way! A fairly good idea is to mine other coins!

Despite the fact that most media outlets are talking about the proof of stake technology to be the next big thing, there are still lots of coins on the crypto market that you can mine. Let’s discover some of the most popular of them.

Ravencoin

For those who feel like embarking on a mining journey all by themselves, Ravencoin is a matching option. This is one of the coins that can be mined with lower capacities and with less professional equipment, that’s why, essentially, anyone can do it because it’s much cheaper than Bitcoin mining.

Ravencoin can be mined with GPU and CPU mining software. By the way, the coin functions on its own blockchain which is a peer-to-peer network for exchanging money-like cryptocurrency. It is a Bitcoin fork that’s why many researchers have admitted that Ravencoin is not a scam coin and that it can potentially have value for many investors in case if there will be enough participants who will be interested in using this network. Ravencoin doesn’t have any master nodes and didn’t go through ICO that’s why it’s more decentralized than some other cryptocurrencies. In fact, this network has found some big-player participants, such as Medici Ventures, the subsidiary of Overstock.

Ravencoin cannot be mined with ASIC hardware. Some types of software, such as MinerGate allows participants to mine the coins using only their phone. Also, you can use one of the multiple mining pools to help you mine this coin. Unlike the strict timeframe of Bitcoin, on this fork, you can mine one block in one minute and get a block reward of 5,000 RVN. Ravencoin is worth less than $1 at the time of writing.

Litecoin

Unlike Ravencoin launched in 2018, Litecoin is one of the cryptocurrency veterans launched in 2011, almost right after the oldest crypto. Before Litecoin, it’s fair to suggest that everyone could imagine Bitcoin to be the only cryptocurrency out there and in the long-term perspective as well. However, now there are thousands of crypto coins on the market and it’s more vibrant than anyone would ever suggest in 2009. So, back to Litecoin, it was forked from Bitcoin as it was the only option at the time to create crypto like Bitcoin which surpasses its main concern – the speed of transactions.

So Litecoin is built in the way that it ensures high-speed transactions because its blocks can be mined much faster than that of Bitcoin, and that’s why transactions settle on a blockchain much faster. Litecoin is an open-source blockchain so anyone can participate. At the time of launch, it was designed to be mined by CPU and GPU only but right now, developers made it possible to work on the underlying protocol with ASIC hardware. It takes 2.5 minutes to mine one block on this blockchain. At the time of writing, the reward for one block is 12.5 LTC. You can also join one of the pools that supports Litecoin mining, like LTC.top or Litecoinpool.

Ethereum Classic

Ethereum Classic work of s an Ethereum protocol that is focused on smart contracts. It facilitates the usage of smart contracts by individuals and businesses, abiding by the principle “code is law”. That’s why more people can use smart contracts to reduce the chance of human error and run coded business instructions on a blockchain.

This type of mining can turn out to be quite profitable because the new block can be mined within 10.3 seconds and the reward for each block is 3.2 ETC. The price per one ETC coin is not as high as the price of ETH but nevertheless, it’s much higher than the other coins that are currently available for mining.

Ethereum Classic is possible to mine with the help of GPU miners like NBMiner and Claymore Miner. Also, you can mine it on the VPS server. A variety of pools do participate in Ethereum Classic mining. Some of those are f2pool and 2 Miners.

Monacoin

Monacoin is a popular Japanese cryptocurrency with quite an active blockchain used by many participants. In fact, it is the first cryptocurrency in Japan. Monacoin is a meme coin like DOGE/USD but instead of a dog, this one is a cat meme. It’s also a quite old coin – Monacoin was launched in 2013 but it’s still alive and has wide community support in Japan.

Options of mining the Monacoin boil down to GPU hardware. Unfortunately, it’s unable to mine these coins with ASIC hardware yet. The time it takes to mine one block is approximately 1.5 minutes. At the time of writing, this cryptocurrency is worth more than $1. The reward for mining one block is currently 12.5 MONA. You can use mining software like  Lyra2REv2 miner and CGMiner. Pools that would help you to mine MONA include la.pool.me and bitpoolmining.

Coinbase IPO Price Prediction

The Coinbase IPO is a turning point in the digital currency industry, there are also threats that stock sales could trigger major price hikes

what is Coinbase IPO? When a company can enter the stock market in accordance with the rules of the stock exchange organization, it must offer its shares for the first time. The first day that a company’s stock is offered to the public on the stock exchange is called an Initial Public Offering. In other words, it is called an IPO.

What is the difference between IPO and ICO?

 IPO belongs to reputable and well-known companies, however, an ICO or Initial Coin Offering may be a high-risk personal project. The purpose of holding an ICO is to raise the initial capital of the project and it is done by start-up companies. If an IPO is held when a company has achieved economic stability and is conducted solely for public expansion. One of the prerequisites for holding an IPO is that companies have a certification of revenue history by a professional auditing firm. While in the ICO process, projects only have white paper, which is not mandatory.

Holding IPO of Coinbase exchange

Coinbase Exchange was established in 2012 in San Francisco. The exchange is a global digital asset exchange company that provides users with a place to buy and sell digital currencies. The company increased its assets under management from $35 billion in 2020 to $90 billion in early 2022.

In April 2021, Coinbase Exchange shares were listed on the Nasdaq Stock Exchange. Following a successful year with more than $1.8 billion in trading revenue, the business information center examined possible upside or downside market scenarios for the initial public offering of Coinbase.

Throughout history, the market has witnessed many fundraising events, such as the ICO and the IEO. However, the entry of IPOs into the digital currency market is a significant development that cannot be achieved by any exchange other than Coinbase. This exchange is one of the largest exchanges in the digital currency industry.

There is a term called “Coinbase Effect” which indicates a significant increase in the value of assets immediately after being listed on the Coinbase Asset List, which can affect not only the stock price but the entire market.

Holding a Coinbase IPO is a justifiable approach. Considering that people like Morgan Stanley, Goldman Sachs, Blackrock and others invest in it, believing that Bitcoin is a tool to maintain financial value. Coinbase also sees this as an important first step in creating a legal and reliable interface between decentralized and traditional financial markets, which could attract large numbers of investors waiting for such a transformation to ensure the dynamism of the cryptocurrency market and digital currencies. To attract.

Rising Bitcoin prices over the past few months have increased Coinbase capital more than eightfold. As was the case with similar examples such as Tesla, the presence of Bitcoin as an asset in a company’s financial balance sheets is a reliable way to raise capital and attract investors, which can ultimately increase the company’s capital and market share value.

Potential impact on the cryptocurrency market

Coin base’s IPO can have both positive and negative effects on the digital currency market as this company has a fundamental position in the industry. Therefore, any oscillation that occurs can have a significant impact on other items based on which it is made.

A positive scenario that can be considered with the successful start of the IPO is that the price of the main digital currencies will increase, as a result of increasing the level of investor confidence and the entry of new players into the field who want to invest and participate in the crypto market.

However, there is a negative scenario that could increase the caution of ordinary investors. Another possibility may be related to the uncertainty of the amount of participation in the initial public offering and its subsequent consequences. As seen in the initial public offering of Facebook shares, the turnout was very high on the first day, yet the stock price fell the next day as public excitement subsided.

If it seems to small investors that it will be difficult for Coinbase to enter the traditional trading market, the same thing could happen to Facebook for Coins.

The results will be disappointing for digital currency audiences, leading to a significant drop in the price of cryptocurrencies that were pre-purchased in hopes of rising prices.

Coinbase IPO Price Prediction

A year ago Coinbase sent a draft to the Securities and Exchange Commission (SEC) to prepare the ground for the IPO of the digital currency exchange. One of the most anticipated initial public offerings of the cryptocurrency is one step closer to being finalized. The company has sent a draft of its IPO to the US Securities and Exchange Commission (SEC).

Coinbase began trading on April 14, 2021 at $381 a share, a 52 percent increase over a $250 reference price set by NASDAQ. A price reference set by a stock exchange on the basis of expectations for where the stock will open.

The stock swung as low as $310 and as high as $429 in a volatile day of trading that reflected the unpredictable nature of cryptocurrency prices. Coinbase ended the day at $328.28, valuing the company at $85.7 billion counting all of its outstanding shares — more than 10 times its last valuation as a private company.

In conclusion

Although the Coinbase IPO is a turning point in the digital currency industry, there are also threats that stock sales could trigger major price hikes or lead to a blow that undermines investor confidence in digital assets, which has recently seen relative growth.

Whichever of these scenarios is implemented, it is likely that Coin base will win the game since it has been able to establish himself in the traditional financial market.

Waht is Sandbox (Sand)?

Sandbox is a blockchain-based game metaverse in which has multiple mechanisms that make sure that the ecosystem is running perfectly.

Sandbox (SAND) is a smart ? contract running on the Ethereum network. It’s a decentralized virtual game, SandBox is also very similar to MANA. The SandBox blockchain-based gaming platform consists of three components that when combined, bring the complete experience for user-generated content. These three products will also further help the users by allowing them to secure copyright ownership for their user-generated content (ASSETS).

What is the SandBox game?

Sand is a game in which players can purchase pieces of land called “Land” (which is also a token) and create upon that by adding a custom user experience on top of it. By doing that you can share it with other players as well, and in doing so you might find a couple of buyers who are willing to pay for your Land at a price higher than you bought it, it all depends on what you’re going to get from playing this game. You may want to keep it to yourself.

The game is a model of a blockchain-based metaverse which has 3 tokens that help keep the ecosystem running. Other than Land which is an NFT type token, two other coins are being used for governance. It means the tokens help govern the operations in-game, one is called Sand and the other is called Assets. Now let’s find out what exactly are these tokens and how they operate and why they are necessary for the SandBox ecosystem.

Sand, Land, Assets

Sand: sand is used to facilitate in-game transactions. That includes purchasing Land, interaction with user-generated experience or just stacking them for the sake of participation in the governance of the DAO (decentralized autonomous organization).

Sand is an essential part of the sandbox ecosystem. Sand is an ERC-20 utility token built on Ethereum’s blockchain that will be used as a basis for in-game transactions in the sandbox metaverse.

Players use sand to change the look of their avatars or buy equipment or maybe play games. Creators use sand tokens to upload their newly made content, buy land, Assets, or even stake them. By staking sand you will create revenue for Land by earning sands by staking it. On top of that, you can also earn gems and catalysts which are required for creating new content. Some creators spend sand to buy gems that will help them define the rarity of their assets which will be defined for the price of those assets when it’s being traded on the marketplace.

Land: the land is a digital piece of real estate in the SandBox metaverse in which users can buy lands and add games and user-generated content and interactive user-generated experience on top of it.

Each land is a 96 x 96 meters piece of real estate in the game world. It’s not too large that you couldn’t take care of it yourself, and it’s not too small that you couldn’t add your ASSETS, games, and user-generated experiences. It’s just the size which means you can manage it on your own and you can still enable all the blockchain game experience. And even if it’s too small, you could still team up and work on an Estate.

Estate is the combination of multiple lands. Using Estates users can team up and work to build and create user-generated experiences on top of a bigger piece of property.

A total of 166,464 Lands will exist on SandBox. Each land has a place on the SandBox metaverse game map.

ASSETS: Assets are tokens made by users who create user-generated content. Assets can also be traded at the marketplace and their whole existence is to be an element for user-generated content and to hold their copyright reserved for the user who owns the asset at the moment. Sites like https://coinboosts.io/ can assist with the marketing of your nft project, using a range of marketing tools to help your collection go viral. 

Sandbox NFT marketplace (as every Asset is an NFT token and is unique from other Assets) allows users to upload, publish and sell their creations. To do so the user has to upload it to the IPFS network to provide the decentralized storage needed for it. Then provide it on the blockchain to provide ownership for the user. After the ownership was provided to the user, that creation becomes that user’s Assets that can be added to your land as your user-generated content or you can trade and sell it on the marketplace. There you can set an initial price for it and let other players buy it.

How catalysts and gems work

According to sandbox “Catalysts are ERC-20 tokens that define your ASSET’s tier and scarcity displayed in the Marketplace. Catalysts add empty sockets to your NFTs that can be filled with Gems; the higher quality the Catalyst, the more sockets available for your ASSET. In other words, the higher the tier, the lower the scarcity, and the more powerful and valuable the ASSET!”

For example, let’s say you have a piece of assets that you want to add to its rarity to epic. You use a catalyst to make empty sockets for those assets, and after you fill the empty sockets with gems, the rarity of those assets will be epic. By doing so the price of the assets rise and can be sold at a much higher price at the marketplace.

In conclusion

Sandbox is a blockchain-based game metaverse which has multiple mechanisms that make sure that the ecosystem is running perfectly.  There are multiple ways you can generate revenue on SandBox. You can purchase land and start adding games, Assets, and self-made user experiences and sell that land at a higher price. You can create Assets and after uploading them you can sell them at the sandbox marketplace. You can stake sands to earn sands for you etc.

If you are looking for a crypto game to play We can recommend sand as it’s a well-thought project with great potential.

Symmetrical triangle pattern

The symmetrical triangle pattern is a technical pattern in which traders who base their strategies on technical analysis’s data use this pattern

The symmetrical triangle pattern is a technical pattern in which traders who base their strategies on technical analysis’s data use this pattern to indicate if the trend will be continued or not. Symmetrical triangle signals that the current trend in which the price moves at the present will be continued or not.

What is a Symmetrical Triangle pattern? What does it mean and how can you trade it?

You should remember that you shouldn’t base your trading on a trading pattern as it’s only a piece of data, when you add this data to other information you collect about the market, you can be sure of the order you’re about to place. Now, let’s not waste more time and find out what exactly is a symmetrical triangle pattern and how you trade using the information it gives you.

What is a Symmetrical Triangle pattern?

The symmetrical triangle pattern consists of two converging trend lines connecting a series of highs and lows. The two trend lines converging should be converging at an equal slope, or at least at roughly equal slopes. If two trend lines are converging at are connecting a group of highs and lows in a trend but aren’t converging at roughly equal slopes, chances are the triangle forming in front of your eyes on the chart isn’t symmetrical triangle pattern. It could be a rising wedge, or an ascending triangle, or a dependent triangle pattern, but it’s not a symmetrical triangle pattern.

What does a symmetrical triangle pattern mean?

To put it shortly, A symmetrical triangle pattern signals a continuation in the current trend. What does it mean?

It means the symmetrical triangle pattern signals to technical analysts that after the price broke out of the symmetrical triangle, it will continue moving on the same trend it was already moving on before entering the triangle.

How is a Symmetrical Triangle formed?

You can look at the symmetrical triangle as a consolidation phase in which the price waits and rests in at a predefined set of highs and lows, the reason for this is that a large group of traders who are also technical analysts will presume that there should be a symmetrical pattern forming. And when the majority of traders believe in that, traders who trade on a low time frame will sell at highs defined by the symmetrical triangle and buy at lows defined by the symmetrical triangle.

How to validate a Symmetrical Triangle pattern?

Like every other technical pattern we use in technical analysis, the symmetrical triangle pattern works best when it’s being used in combination with other factors and pieces of information that help us form our analysis about an individual security’s future price. The other factors are other technical patterns or indicators.

You can also use volume to validate the breakout from the triangle. As the price action moves in the symmetrical triangle and gets close to where the two lines converge the volume has to keep decreasing. This goes true for every pattern that validates the continuation of the trend. And as the pattern gets completed and when the price is about to perform a breakout, you should see a sudden noticeable large increase in trading volume. Reversal patterns on the other hand have a more volatile price movement when the new trend is forming and the volume is considerably lower, this is one way to find out if it’s a trend continuation or trend reversal.

There are other things to look out for. In reversal patterns during the start of an uptrend, the trading volume should be taken more seriously than in downtrends, this is because the traded volume is important for uptrends to kick off.

How to trade a Symmetrical Triangle pattern?

Maybe you are looking at individual security (a coin, stock, pair, etc.) and you see a symmetrical triangle is going to form and the facts support that and you validated that it is an asymmetrical triangle pattern, then you need to know how you should open your order and at what price you’re going to set the take profit and stop-loss orders.

(Picture of a symmetrical triangle completely formed and broke out of the dynamic resistance trend line of the triangle)

If the situation you’re dealing with is a little behind and the triangle hasn’t formed completely nor the price broke out, it’s best if you wait and let the market decide if the price is breaking from the bottom or the top. It is true that based on our analysis we have some clues in which direction the market is about to move, but everything is possible in the market.

That means no matter how good an analyst or trader we are, how the whole situation looks perfect and you just know that it’s going to move in an upward direction, you should be ready to not lose your cool if the market starts moving downwards.

If the price just broke the triangle and everything looks valid you can enter at the point where the triangle is broken and set the stop-loss a little below the last low in the triangle if it’s an uptrend, and put it a little above the last top if it’s a downtrend.

How to calculate the targets in a symmetrical triangle pattern?

For every triangle pattern out there, there are multiple techniques to calculate the targets for your take-profit orders.

For symmetrical triangle patterns, two ways will help you calculate. The easiest way to do so is to find a point at which the lines of the triangle have the most vertical difference and add the difference where the price breaks out of the triangle. You got your final target, all you have to do now is to set the take profit order price as your strategy.

Gemini vs Coinbase

Gemini vs Coinbase have complex cost structures with several distinct differences. Both exchanges do not charge any fees. To read more, follow our website.

In this article, we review Gemini vs Coinbase. Finding a reputable digital currency exchange is the first and most important challenge for people who have chosen the digital currency market to invest. With the development of the cryptocurrency market, the number of digital currency exchanges is also increasing.

Choosing an exchange is an integral step in buying and selling digital currency. There is no doubt that the exchange must also support the tokens you want to purchase. Coinbase and Gemini have extensive lists of supported cryptocurrencies, but some exchanges, such as Binance, have longer lists. In addition, two features that traders may want to trade in are learning resources and advanced trading tools such as technical analysis indicators. Each platform has its own resources to help beginners learn the basics of crypto and more. Gemini has a slight advantage in trading tools over Coinbase, yet both are good enough for simple technical analysis and research.

Gemini vs Coinbase: Overview

Coinbase was founded in 2012 with the ultimate goal of creating an open financial system where anyone can buy digital currencies anywhere. Initially, the platform only offered bitcoins, but since its launch, it has listed more than 65 digital currencies. Coinbase is actively accelerating the listing process and providing a variety of investment opportunities for his clients.

On June 24, 2021, the team launched a tool called Solidify to help list some new tokens even faster. While the platform lists more passwords than some exchanges, its biggest advantage over many other exchanges is its security. Coinbase has all the security alarms and whistles that top exchanges should have and more.

One of Coinbase’s weaknesses is that it does not support countries as much as Gemini. Its full service is available in Australia, Canada, Singapore, USA, UK and long list of European countries. It also allows more than 100 countries to switch between digital currencies, but residents of many of those currencies cannot deposit or trade with Fiat money on the platform. Coinbase plans to expand his services to more countries in the future.

Gemini is a popular cryptocurrency exchange founded by a twin pair of revolutionary investors, Tyler and Cameron Winklevoss. The Winklevoss twins have been part of the digital currency community since they bought 1% of the total Bitcoin supply, reportedly less than $10 per coin. Just a few years later in 2014, the twins founded Gemini and quickly became one of the safest platforms for trading digital currencies.

Gemini says it works with a safety mindset and has taken extensive security measures to prove it. It was one of the first cryptocurrencies to be licensed by the New York State Department of Financial Services (NYSDFS). New York has stricter regulations on digital currency services than most states, and Gemini and Coinbase are two of the shortlisted NYSDFS-licensed exchanges.

Coinbase vs Gemini: Fees

Coinbase and Gemini have complex cost structures with several distinct differences. Both exchanges do not charge any fees for depositing digital currencies and ACH instant bank transfers. If you want to secure your account with wired remittances, you may prefer Gemini. There is no charge, while Coinbase receives $10 for wire transfer deposits and $25 for output wires.

Gemini splits its costs depending on the size of the transaction – it charges a fixed fee for orders under $200 and 1.49% for large transactions. Coinbase has a slightly more complex fee structure that depends on the payment method and the region. In the United States, using a linked bank account or USD Coinbase wallet for a purchase costs 1.49%, while using a cash card or PayPal costs 3.99%. It has a handy guide that splits the costs for each area and the payment method at its help center.

Coinbase and Gemini each have another free platform dedicated to active or more experienced traders. These platforms use a build model that costs less than the original platforms. This model is designed in such a way that for transactions that take liquidity out of the market, it receives a higher fee than creating liquidity. For instance, if you open a transaction that fills up immediately, you are withdrawing liquidity from the market and you will be charged a slightly higher fee. These costs also decrease as the order size increases. The Gemini ActiveTrader costs a little less for trades less than $50,000, and the Coinbase Pro is cheaper. If you are looking to reduce your costs as much as possible, each of these build models can be a cheaper option depending on the size of your transactions.

Coinbase vs Gemini: Security

Both Coinbase and Gemini are as secure as possible for today’s large digital currency exchanges. The platforms store most of the user’s funds in the cold (offline) and fully insure a small percentage in hot bags (online for daily liquidity). Coinbase says it keeps 98 percent of the users’ cryptocurrencies it controls in geographically separate cold storage locations (warehouses, safes, etc.). Gemini has not stated what percentage of users’ cryptocurrencies are stored in the cold, yet insures all funds in hot wallets.

In addition, Your USD is safer on Coinbase and Gemini. The Federal Deposit Insurance Corporation (FDIC) insures USD on platforms up to $250,000 per user. Exchange offices have few vulnerabilities and most of them are insured in the event of a malicious attack. The main danger that affects all exchanges is login security, which is another priority of Gemini and Coinbase. For example, 2-factor authentication can (and should) be enabled on any platform, adding an extra layer of security to prevent malicious attackers from accessing user accounts.

Coinbase Custody (a platform built on Coinbase for storing funds) completed the System and Control Organization (SOC) 1 and 2 exams in 2019. Gemini was also one of the first digital currency exchanges to complete SOC 1 and 2 examinations. Company for key issues such as security, processing integrity, privacy and availability. These audits only reinforce the notion that companies are safe and working properly.

Gemini vs Coinbase: Access

Gemini and Coinbase are both available worldwide, and Gemini is currently available in far fewer countries than Coinbase.

Gemini is available in all 50 states, while Coinbase is available in all but Hawaii. Both companies comply with all US regulations for trading digital currencies. Each country has its own rules about digital currencies so be sure to review your local guidelines before buying or selling digital currency.

So Gemini or Coinbase?

Both of these exchanges are secure with subtle differences in fees and features. Your preference may depend on where you are (if one of them does not support your country), the digital currencies you want to trade, and how your trading strategy matches the fee structure of each exchange. Large traders who want to buy or sell digital currencies worth more than $50,000 may turn to Coinbase Pro for lower costs. On the other hand, traders in South Korea or the Philippines may want to choose Gemini since most Coinbase services are not available in their countries. Either way is probably a good option, however the small details may make one better for the other.

Which one is easier to use, Gemini or Coinbase?

The Gemini is based on ease of use, and its ultra-clean interface proves it. Gemini with a simple price list and the ability to buy, sell or exchange cryptocurrencies is easily one of the best user experiences for exchanging them.

To sign up for Gemini, simply create a free account using your email address and password. Once you have verified your email address, secure your account with 2-step authentication and connect your bank account or cash card. From there, you can start buying digital currency right away.

Similarly, Coinbase gives users an easy way to sign up, connect their financial accounts, and purchase cryptocurrencies in their app. You can sign up for Coinbase with an email address and password, and then verify your identity with a government photo ID by uploading an image to the app or website. Once verified, you can attach a bank account or credit card to start purchasing digital currency immediately.

In conclusion

It is nearly impossible for you to go wrong with Gemini or Coinbase as both are top exchanges for a reason, as trading platforms offer user-friendly cryptography with excellent security and no real weakness.

Of the two, Coinbase is a significant choice in terms of digital currencies. If you are planning to invest in a large number of different coins, Coinbase is probably the right exchange for you.

Assuming you use Gemini ActiveTrader and trade less than $50,000 a month in crypto, Gemini can save on transaction costs. There is not much difference in transaction fees between the two exchanges, but for long-term investments, even small amounts increase.

Meta: Gemini and Coinbase are digital currency exchange platforms designed to trade these currencies. Each of them has its own properties which predominate the other one.

How to sell NFT on opensea?

Buying and selling NFT on opensea is not as difficult as you might think. keep in mind that there are many scammers in this area and prices can vary greatly

Buying and selling NFTs in the OpenSea marketplace is not complicated and here is a step-by-step guide on how to do it quickly and safely. Prior to diving into how to sell and buy NFT in OpenSea, let’s take a step back and briefly recall what non-fungible tokens are.

What is OpenSea?

OpenSea is a decentralized game changer market for NFT trading. If you’re surprised, NFT stands for Non-Fungible Tokens, which are unique and collectible digital items such as in-game assets, avatars, business cards and art.

In mid-2021, OpenSea recorded $3.5 billion some in NFT trading volume alone. Given that it had a volume of only $21 million throughout 2020, it can be said that a 12,000 percent increase in business activity is definitely a sign of success. Mark Cuban, Kevin Durant, Ashton Kutcher, and crypto powerhouse are the investors who have helped push OpenSea’s valuation to more than $1 billion, giving seemingly the NFT platform unicorn status overnight.

Collectors, artists, investors and NFT traders all rate OpenSea highly, but if you are new to this platform, it is very confusing. This OpenSea Beginner’s Guide gives you an easy-to-use guide to NFTs, what OpenSea + is, and how to use it, along with some of the best NFTs on the market.

What is OpenSea NFT Marketplace?

OpenSea considers itself the first and largest NFT market in the world. But to put it simply, you can think of OpenSea as an eBay for digital objects and collections.

In 2017, Alex Atallah and Devin Finser founded OpenSea in New York City. Shortly afterwards, they joined the famous startup Y Combinator and immediately received $ 2.7 million in support.

The OpenSea team had a lot to prove in the beginning. Prior to 2021, NFTs were still on fire, apart from early modes such as CryptoKitties. However, the team’s vision that people would soon value digital objects more or more than physical objects began to take hold. Here’s a little understanding of OpenSea.

Cryptocurrencies provided the blueprint for the current NFT boom. Globally, people trade digital currencies and instrument tokens around the clock. They are digitally comfortable with items they cannot see or feel, indicating that the indigenous digital age is really here.

Interacting with digital objects is becoming commonplace as more and more people make their living online. However, while in the early days of the web, people sought to bring physical space into digital, the current stage is all about digital creativity – such as good behavioral patterns, games, and interactive experiences.

This is also why people are moving away from selfies for profile photo avatars on social media platforms such as Instagram, Twitter and TikTok. Instead, cartoon avatars of penguins, pixelated punks, and tangled monkeys are captured with laser eyes.

In a broader sense, all of these indicators point to the beginning of the meta-transformation – the shared cyberspace that we all create and own together, in which NFTs play an important role. So, when we think of OpenSea, we can easily call it eBay digital objects, but in fact, it is much more than that.

When you buy an NFT, it’s yours, just as the food is delivered to you after payment. Yet, what happens when you want to transfer, sell, or search for something like that? What if you plan to buy NFT but want to easily see its ownership history?

Before OpenSea, there was no easy way to do any of these things. Yes, OpenSea is a peer-to-peer NFT marketplace, but it is also the interface layer between the blockchain and everyday consumers that makes it easy for anyone to buy or access NFTs.

What is a Non-Exchangeable Token (NFT)?

Non-replaceable tokens, or NFTs, are assets encrypted in a blockchain with unique identification codes and metadata that distinguish them from each other. Unlike digital currencies, they cannot be traded or exchanged as equivalents. This is different from interchangeable tokens, such as cryptocurrencies, which are identical to each other and can therefore be used as a medium for trading.

The distinctive structure of each NFT has the potential to use several. For instance, they are an ideal tool for digitally displaying physical assets such as real estate and works of art. As NFTs are blockchain-based, they can be used to remove intermediaries and artists communicate with the audience, or to manage identities. NFTs can eliminate intermediaries, simplify transactions, and create new markets.

Most current NFT markets are centered on collectibles, such as digital artwork, sports cards, and rare items. The NFT version of the first tweet has been offered for up to $2.5 million.

Why do people buy/sell NFTs?

There are many reasons to buy/sell NFTs. The most basic of these is because they want to invest in a new, speculative and highly volatile asset. The NFT market exploded in 2021, and many collections, such as CryptoPunx or the Bored Ape Yacht Club, saw their ratings skyrocket.

However, apart from speculating about future valuation, some investors opt to buy NFTs as a form of digital art. As the world moves further and further towards the digital future in which much of our interaction and time is spent online, and as the concept of Metaverse continues to grow rapidly, many people want rare art and Have a valid digital.

Other people may buy an NFT as a gift to someone they know appreciates it and so on. The reasons are different, but it is a fact that the market has become a significant market that should not be ignored.

Now, let’s see how to sell an NFT in OpenSea.

In opensea.io website, go to your image in profile at the top right and click on Profile bottom. Select the NFT you aim to sell from wallet. If you don’t have an NFT available to sell, check our create an NFT tutorial to get started.

Select Sales at the top right to go to the list page.

You will be taken to a list page, where you can select the price and type of sale. A fixed price sale is a sale where the price remains constant. In the image below, the price of 1 ETH is fixed. Click here for more information on timely auction sales.

You can also specify the duration of the sale. The default options are 1 day, 3 days or 1 week – yet you can also set a custom time using the calendar.

You can also put the item in a package (NFT grouping from different sets). Finally, you can also book the goods for a specific buyer. To do this, simply enter their address in the field below the reservation for a specific buyer.

In all of these options, you will see potential sales costs below. In this case, the sale includes OpenSea service costs of 2.5% and generating revenue of 10% for a total of 12.5%. This is the highest percentage that can be deducted from NFT sales in OpenSea.

Finish up your sale

You will then be asked to confirm your sale by signing a deal. Please note, if you have never sold in OpenSea before, you must first initialize your wallet. Also, if the item you are listing is not made in OpenSea, but is made through a custom contract, an additional confirmation and signature may be required to allow OpenSea to trade the product on your behalf.

After completing your list, you will receive a pop-up confirmation like the one below. Be sure to share your list on social media!

To view the items you have listed for sale, select the Activity tab from your profile page. You will see the item you just listed with the list of transactions.

In summary

Buying and selling NFT in OpenSea is not as difficult as you might think. However, keep in mind that there are many scammers in this area and prices can vary greatly. It is not uncommon to see people lose their money to fraudsters through phishing or carpet weaving. The NFT field is also full of laundering traders who create fake trading volumes in certain collections to make them more attractive to investors.

In any case, it is important to keep in mind that this is a very young market that is not strictly controlled n most jurisdictions. Thus, you need to pay attention to it and take the necessary precautions to protect your capital.

Exit mobile version