The financial markets are complex and unpredictable, and traders are always looking for new and innovative ways to outperform the market. One of the most popular strategies for trading in the financial markets is technical analysis. Technical analysis involves studying charts and identifying patterns that can provide insight into future price movements.
One such pattern is the ascending triangle pattern. The ascending triangle pattern is a bullish pattern that is formed when the price of an asset is consolidating in a narrowing range. This pattern indicates that there is a conflict between buyers and sellers, with buyers becoming increasingly aggressive and driving the price higher.
You can also read: Maximizing Your Portfolio with the Wheel Strategy
Introduction to Ascending Triangle Patterns
The ascending triangle pattern is a variation of the triangle pattern and is considered a bullish pattern because it indicates that buyers are gaining strength and are likely to push the price higher. It is an important pattern that traders use to identify potential entry and exit points for trades. By correctly identifying and analyzing the pattern, traders can potentially outperform the market and achieve significant profits.

Traders can use various technical indicators to confirm their analysis of the ascending triangle pattern. These indicators include the relative strength index (RSI), moving averages, and volume indicators. The RSI measures the strength of the trend, and if it is trending higher and is above its 50-day moving average, it is a bullish signal.
What is an Ascending Triangle Pattern?
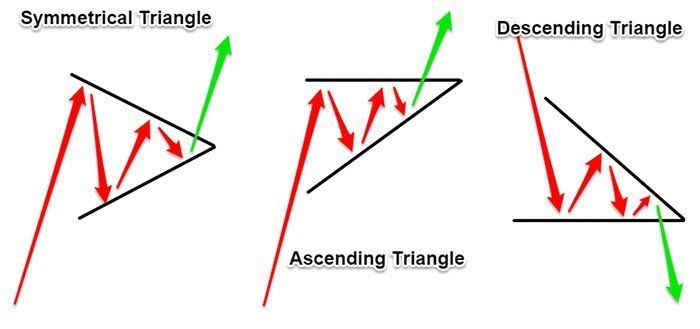
An ascending triangle pattern is a bullish pattern that is formed when the price of an asset is consolidating in a narrowing range. This pattern is characterized by a horizontal resistance level that acts as a barrier preventing the price from moving higher. At the same time, a series of higher lows indicate that buyers are becoming more aggressive.
The ascending triangle pattern is a variation of the triangle pattern, which is a common pattern in technical analysis. The ascending triangle is considered a bullish pattern because it indicates that buyers are gaining strength and are likely to push the price higher.
Benefits of Using an Ascending Triangle Pattern
The ascending triangle pattern has several benefits for traders who use it in their analysis. Here are a few key benefits:
- Clear Entry and Exit Points: The ascending triangle pattern provides clear entry and exit points for traders. Traders can enter a long position once the price breaks above the resistance level, and they can exit the position if the price falls below the support level.
- Easy to Identify: The ascending triangle pattern is relatively easy to identify, even for novice traders. Traders can use charting software or technical indicators to identify the pattern and confirm their analysis.
- Strong Bullish Signal: The ascending triangle pattern is a strong bullish signal that indicates buyers are gaining strength and are likely to push the price higher. Traders can use this pattern to enter long positions in the asset and potentially outperform the market.
- Low Risk, High Reward: The ascending triangle pattern provides traders with a low-risk, high-reward opportunity. Traders can enter a long position with a stop-loss below the support level, limiting their risk while potentially enjoying significant profits if the price moves higher.
Strategies for Trading with an Ascending Triangle Pattern
There are several strategies that traders can use when trading with an ascending triangle pattern. Here are a few key strategies:
- Breakout Trading: Breakout trading is a popular strategy that traders use when trading with an ascending triangle pattern. Traders wait for the price to break out above the resistance level before entering a long position in the asset. The breakout should be accompanied by high trading volume to confirm the strength of the trend.
- Retest Trading: Retest trading is another strategy that traders can use when trading with an ascending triangle pattern. Traders wait for the price to break out above the resistance level and then wait for a retest of the level before entering a long position. The retest should be accompanied by lower trading volume to confirm that the level is now acting as support.
- Stop-Loss Placement: Stop-loss placement is a crucial strategy when trading with an ascending triangle pattern. Traders should place their stop-loss below the support level to limit their risk in case of a false breakout or a sudden price movement.
Characteristics of Ascending Triangle Pattern
The ascending triangle pattern is characterized by a series of higher lows and a horizontal resistance level. The resistance level acts as a barrier that prevents the price from moving higher, but as buyers become more aggressive, the resistance level is eventually broken, and the price moves higher.
The key characteristics of an ascending triangle are:
1. A horizontal resistance level that acts as a barrier to further price movement.
2. A series of higher lows that indicate buyers are becoming more aggressive.
3. Increasing trading volume as the pattern forms, indicating a growing interest in the asset.
Identifying Ascending Triangle Pattern
Identifying an ascending triangle pattern is relatively simple. Traders need to look for a series of higher lows and a horizontal resistance level. To confirm the pattern, traders should also look for increasing trading volume as the pattern forms.
Once the pattern is identified, traders can use technical indicators to confirm their analysis. One such indicator is the relative strength index (RSI), which measures the strength of the trend. If the RSI is trending higher and is above its 50-day moving average, it is a bullish signal.
Trading Ascending Triangle Pattern
The ascending triangle pattern is a bullish pattern that indicates that buyers are becoming increasingly aggressive. Traders can use this pattern to enter long positions in the asset, with a stop-loss below the support level.
To trade the ascending triangle pattern effectively, traders should wait for the breakout above the resistance level before entering a long position. The breakout should be accompanied by high trading volume to confirm the strength of the trend.
Traders should also be aware of false breakouts, where the price breaks above the resistance level but then quickly returns to the consolidation range. To avoid false breakouts, traders should wait for a close above the resistance level before entering a long position.
Alternatives to the Use of an Ascending Triangle Pattern
While the ascending triangle pattern is a powerful tool for traders, it is not the only pattern that traders can use in their analysis. Here are a few alternatives to the use of an ascending triangle pattern:
- Descending Triangle Pattern: The descending triangle pattern is a bearish pattern that is the opposite of the ascending triangle pattern. This pattern is characterized by a horizontal support level and a series of lower highs. Traders can use this pattern to enter short positions in the asset.
- Head and Shoulders Pattern: The head and shoulders pattern is a reversal pattern that is formed after an uptrend. This pattern is characterized by a peak (the head) and two smaller peaks (the shoulders) on either side. Traders can use this pattern to enter short positions in the asset.
- Double Bottom Pattern: The double bottom pattern is a bullish reversal pattern that is formed after a downtrend. This pattern is characterized by two consecutive bottoms at the same level. Traders can use this pattern to enter long positions in the asset.
How to use moving averages to confirm the ascending triangle pattern?
Moving averages are one of the most commonly used technical indicators to confirm the analysis of the ascending triangle pattern. Moving averages are calculated by taking the average price of an asset over a specific period, and they are used to identify the direction of the trend.
To use moving averages to confirm the ascending triangle pattern, traders typically use two types of moving averages: the simple moving average (SMA) and the exponential moving average (EMA).
The SMA is calculated by taking the average price of an asset over a specific period, such as 50 or 200 days. The EMA is similar, but it gives more weight to recent price action, making it a more responsive indicator.
To confirm the analysis of the ascending triangle pattern using moving averages, traders typically look for the following:
- The price of the asset should be trading above the moving average. This indicates that the asset is in an uptrend, which is consistent with the bullish nature of the ascending triangle pattern.
- The moving average should be sloping upward. This indicates that the trend is gaining strength, which is also consistent with the bullish nature of the ascending triangle pattern.
- The price should be trading above the moving average during the formation of the ascending triangle pattern. This indicates that the buyers are in control, and the trend is likely to continue higher.
- When the price breaks above the resistance level of the ascending triangle pattern, the moving average should continue to slope upward, indicating that the trend is gaining strength.
By using moving averages to confirm the analysis of the ascending triangle pattern, traders can potentially increase the accuracy of their trades and reduce their risk. However, it is important to note that no technical indicator is 100% accurate, and traders should always use proper risk management techniques and have a clear trading plan in place before entering any position in the financial markets.
Examples of Ascending Triangle Patterns
Let’s explore a few examples of how the ascending triangle pattern has played out in the financial markets.
Example 1: Bitcoin (BTC/USD)
In early 2021, Bitcoin was forming an ascending triangle pattern on the daily chart. The pattern was characterized by a horizontal resistance level at $42,000 and a series of higher lows. As the pattern formed, trading volume increased, indicating a growing interest in the asset.
On September 7, 2021, Bitcoin broke above the resistance level, accompanied by high trading volume. Traders who entered a long position at the breakout enjoyed a significant profit as Bitcoin continued to rally higher.
Example 2: Apple Inc. (AAPL)
In early 2021, Apple Inc. was forming an ascending triangle pattern on the daily chart. The pattern was characterized by a horizontal resistance level at $140 and a series of higher lows. As the pattern formed, trading volume increased, indicating a growing interest in the stock.
On January 26, 2021, Apple broke above the resistance level, accompanied by high trading volume. Traders who entered a long position at the breakout enjoyed a significant profit as the stock continued to rally higher.
Example 3: Gold (XAU/USD)
In early 2021, Gold was forming an ascending triangle pattern on the daily chart. The pattern was characterized by a horizontal resistance level at $1,900 and a series of higher lows. As the pattern formed, trading volume increased, indicating a growing interest in the asset.
On January 6, 2021, Gold broke above the resistance level, accompanied by high trading volume. Traders who entered a long position at the breakout enjoyed a significant profit as Gold continued to rally higher.
In conclusion
The ascending triangle pattern is a powerful bullish pattern that can provide valuable insights into future price movements. Traders who can identify this pattern and trade it effectively can potentially outperform the market.
To trade the ascending triangle pattern effectively, traders should wait for the breakout above the resistance level before entering a long position. The breakout should be accompanied by high trading volume to confirm the strength of the trend. Traders should also be aware of false breakouts and wait for a close above the resistance level before entering a long position.
As always, traders should use proper risk management techniques and have a clear trading plan in place before entering any position in the financial markets.