Dark Pools are created to facilitate block trading by institutional investors aiming not to influence markets with their large orders and transactions.
Dark Pool Trading, or printing, is an OTC (over-the-counter) blockchain transaction through a private exchange that is only available for institutional investors. These private exchanges are known as “dark pools” due to a lack of full transparency. According to the CFA institute’s report, the popularity of dark pools continues to grow, with an estimated 50 percent of all stock trading in dark pools in 2022 compared to 40 percent in 2017.
Digital currencies have become one of the mainstays of the global economy in recent years, and most of the tools and strategies used in traditional financial markets have also found their way into the cryptocurrency market. Dark Pools were also one of the trading facilitators in traditional financial markets such as the stock market, which entered the crypto market.
Dark transactions in the cryptocurrency market are decentralized and are called “Decentralized Dark pool”. Some online digital currency platforms provide such transactions for large cryptocurrency market investors.
These platforms use rigorous digital security verification protocols to secure transactions. They also use the proof zero-knowledge protocol to verify the accuracy and transparency of the ongoing blockchain transaction. This protocol carefully verifies and confirms their digital identities in full compliance with the blockchain privacy policy and the protection of information and data of the parties to the transaction.
One of the issues provided by a dark pool trading in traditional markets is the possibility of infiltration by one of the parties to the transaction in order to change the price in advance. Yet, in the decentralized type of these transactions, it is not possible for any person to influence to change the transaction figure and the predetermined rate will not be manipulated in any way.
Due to the confidential nature of this network, trading in this network can prevent severe fluctuations in the cryptocurrency market, as when a big investor decides to buy and sell digital currency; the release of the news of this transaction affects the market and changes its standard trend. These sudden changes can be detrimental to cryptocurrency traders and micro-investors. Failure to publish heavy trading news will prevent such fluctuations.
How do dark transactions work?
The dark trading system in various financial markets, such as stock exchanges, allows institutions to buy and sell in the financial market such as securities and their derivatives or other similar instruments without disclosing trading details and is a substitute for normal trading on the stock exchange as well as the other financial markets.
This trading system is called Dark Pool, which means “black pool”. In a non-transparent trading network, transaction information is not recorded in the market registry and these exchanges are not exposed to the public. In a nutshell, we can say that the trading network is not transparent and the history of transactions is not made public.
The liquidity in circulation in these exchanges is called “black pool liquidity” and transactions in these networks are generally done in blocks. Block trades are high-volume trades and predetermined amounts.
Why tracking Dark Pool Trades is crucial for Traders?
Understanding dark pool prints is critical to identifying futures market movements, changes in trends and levels of support and resistance.
The dark pool prints of the pool indicate the progress of future market movements:
This is especially true for key indicators such as SPY. Archival, SPY dark pool prints are a powerful indicator of major future market movements. The pattern of multiple large trades with bullish characteristics has predicted very large upward fluctuations in the whole market and the opposite pattern has predicted major recessions.
Also, dark Pool prints can indicate the beginning of a trend or a change of trend:
These prints have been just as powerful in showing the start of a trend or booking for each tick. The pattern of several large trades with ascending characteristics on a tick with other descending characteristics can indicate a change in the trend, or the same pattern can indicate the beginning of a trend in a one-off, otherwise, side trades are made.
Accumulation of dark pool printing can identify levels of support and resistance:
Tracking the price level at which dark pool prints are traded over time helps identify support and resistance levels. If a tick is declining, identifying large dark pool print stacks below current prices reveals support levels that may occur in reverse. The higher the trading volume at that price, the stronger the support level. The same is true for large accumulations above current prices. The price with the highest accumulated volume can indicate the level of resistance at which the tick may stabilize and reverse.
Finally, dark Pool prints provide a complete picture of market value:
Without a complete picture of dark pool prints, traders may end up paying too much for a stock. Consider the retailer in the example above who was unaware of a large dark transaction that would affect stock prices if traded through the public stock exchange.
How to track dark pool trades?
There are many simple tricks you can use to indirectly detect activity in a dark pool. As a trader, you cannot really look at the pools themselves. However, you can see the traces of their trades in the public markets.
It’s a bit like looking out the window to see how much the wind is blowing. The wind itself is invisible, yet you can indirectly measure its presence by watching the leaves blow around.
Based on expert experiences, there are many simple tricks you can use to indirectly detect activity in a dark pool. As an investor, you cannot really look at the pools themselves, but you can see the traces of their trades in the public markets.
An easy method to detect dark pool activity is to monitor the internet. Financial journalists are constantly competing to cover big institutional deals. Also, they are not easily distracted by something like a private computer network.
If you do not trust journalists, you should set up Google Alerts for various mutual funds and other institutional investors. They are ultimately required to disclose all their transactions, even if sometime later. By making sure you are the first person to know about dark trades, you can surpass them in money-making.
Conclusion
As we mentioned above, a dark pool can have problems as well as benefits. The system gained a lot of popularity only in the first years, but over time, with the dark dimensions of black pools, institutions and investors tried to stay away from the network for greater stability and security of economic exchanges and financial markets.
However, the dark pool trading network is still in place and, as we mentioned, it has entered the cryptocurrency market. In the world of digital currency, the terms of these transactions are somewhat more favorable, more secure, and more logical. Since large corporations do not have a large share of the market, crypto dark pool trading is not thriving at the moment. We have mentioned many times that the black pool is suitable for large and large transactions; so it is better to use cryptocurrency exchanges to do your trading deeds.
Ichimoku cloud is a method of technical analysis that is often simply called Ichimoku. It is based on the Japanese candlestick chart to predict future price movements.
Ichimoku Clouds are a set of technical indicators that show the levels of support and resistance, as well as the movement and direction of the trend. It does this by taking multiple averages and plotting them on a graph. It also uses these figures to calculate a “cloud” that tries to predict whether prices may be supported or resisted in the future.
The Ichimoku Cloud was developed by Japanese journalist Guichi Hosoda and published in the late 1960s. Provides more data points than a standard candlestick chart. While it may seem complicated at first glance, those who are familiar with how to read charts often find it easy to understand with well-defined trading signals.
Knowing the Ichimoku diagrams
Before a trader can perform effectively on a chart, a basic understanding of the components of the Ichimoku chart must be established. Ichimoku was created and unveiled in 1968 in a way that differs from other technical indicators and applications. While programs were typically formulated by statisticians or mathematicians in the industry, the indicator was developed by Tokyo-based writer Guichi Hosoda and a handful of assistants doing various calculations. This indicator is now used by many chambers. Japanese commercial is used because it offers several experiments. In price practice, creating trades is more likely. Although many traders are afraid of the abundance of lines drawn when applying charts, components can easily be translated into more accepted indicators.
The program consists of four main components and provides the trader with key insights into the FX market price. We will first look at the Tenkan and Kijun Sens lines. The lines are used as a moving average crossover and can be used as simple translations of the 20- and 50-day moving averages, albeit at slightly different intervals.
1. Tenkan Sen: is calculated as the sum of the highest, highest and lowest divisors. Tenkan is calculated in the previous 9 time periods.
2. Kijun Sen: is calculated as the sum of the highest and lowest divisors. Although the calculation is similar, Kijun takes into account the past 26 time periods.
What the trader wants to do here is use a cross to start the position – similar to a moving average cross. Looking at our example in Figure 1, we see a clear intersection of Tenkan Sen and Kijun Sen. This decrease simply means that prices will fall below the long-term price trend in the short term, which is a sign of a downtrend or lower movement.
Now let’s take a look at the most important component, the Ichimoku Cloud, which reflects current and historical price performance. By creating formative barriers, it behaves almost like simple support and resistance. The last two components of the Ichimoku program are:
3. Senkou Span A: The sum of Tenkan Sen and Kijun Sen divided into two. The calculation is then drawn 26 times before the current price action.
4. Senkou Span B: The sum of the highest, highest and lowest divides by two. This calculation is taken in the last 52 time periods and 26 previous periods.
After drawing on the chart, the area between the two lines is called a Kumo or cloud. The cloud, which is relatively thicker than normal support and resistance lines, provides a complete filter for the trader. The thicker cloud considers fluctuations in foreign exchange markets instead of giving the trader a thin price level to support and resist. Breaking the cloud and moving it up or down there suggests a better and more likely trade.
What do the Ichimoku clouds represent?
The technical indicator shows the relevant information at a glance using averages. When the price is in the cloud, the general trend is upward, when the price is below the cloud, the downward trend and when the price is in the cloud, it is without trend or in transition.
When the leading distance A rises and is above the leading opening B, this helps confirm the uptrend, and the space between the lines is usually green. This helps to confirm the downtrend when the leading distance A is falling and is lower than the leading distance B. The space between the lines is usually red in this case.
Traders often use the Ichimoku Cloud as a support and resistance area depending on the relative price position. The cloud provides support/resistance levels that can be predicted in the future. This sets the Ichimoku Cloud apart from many other technical indicators that offer only support and resistance levels for the current date and time.
Traders should use the Ichimoku Cloud along with other technical metrics to maximize their risk-adjusted returns. For instance, this indicator is often paired with the Relative Strength Index (RSI), which can be used to confirm movement in a particular direction. It is also important to look at larger trends to see how smaller fit into them trends. For example, during a very strong downtrend, the price may temporarily push the cloud or slightly above it, before falling again. Just focusing on the indicator means losing the bigger picture, as the price is under strong long-term selling pressure.
Crossovers are another way that markers can be used. Be careful that the conversion line moves above the baseline, especially when the price is above the cloud. This can be a powerful buy signal. One option is to hold the trade until the conversion line returns below the baseline. Each of the other lines can also be used as an exit point.
Ichimoku Cloud Lines
The Senkou Span A and Senkou Span B lines are used together to form cloud formation in the Ichimoku Kinko Hyo diagram, also called the Ichimoku cloud. Ichimoku Cloud was created in Japan and combines five different lines that provide different insights to the trader.
Senkou Span A belongs to Senkou Span B because it forms the “cloud” that is the main component of the Ichimoku Cloud.
The Senkou Span B line is considered to be the slower motion of the two lines because it is calculated using 52 data periods (52 high periods + 52 low periods) / 2). Senkou Span A, on the other hand, uses 26-period and 9-period data-based data, so it responds more quickly to price changes.
In general, when the Senkou Span B reaches a high position in the cloud, a bearish signal is considered. This is because short-term prices are lower than mid-term long-term prices. Senkou Span lines measure the midpoint of a price range because they divide the combined high and low values into two.
When the Senkou Span A line is at the top of the cloud, it is considered an uptrend as the short-term price moves above the long-term medium-term price. Crossovers between Span A and Span B can indicate a change of trend, from descending to ascending or vice versa.
When prices are higher than Span A and/or Span B, these lines may act to support and provide potential shopping areas. When the price is lower than Span A and/or Span B, these lines may act as resistance and provide potential areas for sale or short-term.
Here’s how to decipher the Ichimoku cloud:
1. High, low and static trends
Using Ichimoku’s trading strategy, you can view your trading information at a glance using averages. The general trend increases when prices rise above the cloud. Conversely, when the price reaches below the cloud, the trend decreases. However, when the price remains in its position in the cloud, the trend or transfer stops.
2. Approve the process
When a trend is created, a color is usually assigned to it. Therefore, if the leading distance A is higher than the leading opening B, it is said that the uptrend is confirmed and the space between the lines is green. Conversely, if the leading distance A falls below the leading opening of B, it creates a downward trend and the space between the lines turns red.
3. Aspects of support and resistance
As a trader, based on the relative price position of your script market, you often use the Ichimoku cloud as a support and resistance area. You can also get support and resistance levels that may be expected for futures trading. It is this virtue that distinguishes Ichimoku Cloud Trading from most other technical indicators, which usually offer only support and resistance levels for current trades.
In conclusion
The Ichimoku chart indicator is scary at first, but was broken once. Any trader will find this app useful. This chart shows the three indicators to one and provides a filtered approach to price performance for the currency trader. In addition, this approach not only increases the likelihood of trading in financial markets, but also helps to isolate real motion games. Ichimoku is an alternative to risky trades, where the opportunity has a chance to return the previous profit.
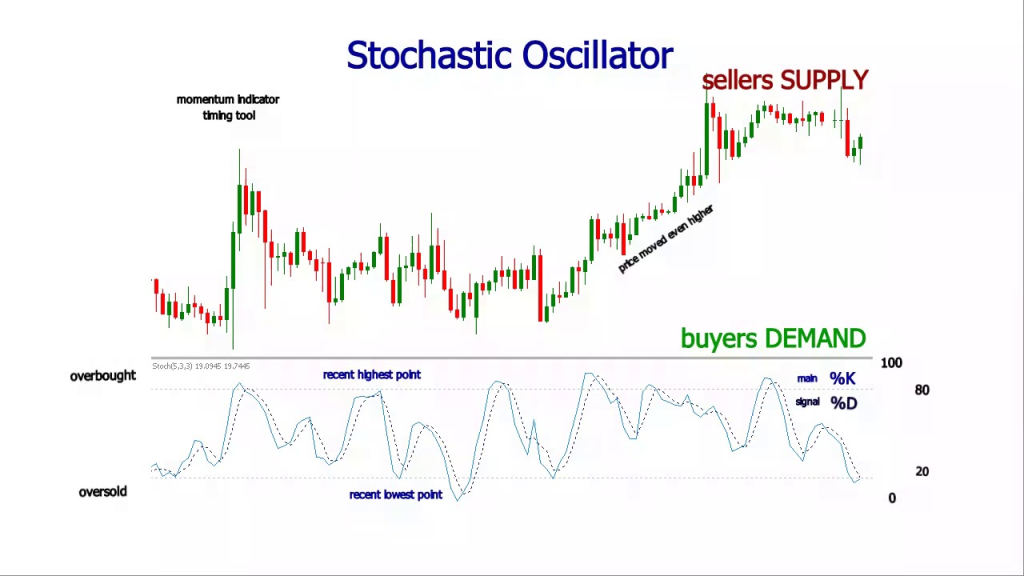
The stochastic indicator is a 2 lined indicator can be applied to charts. It moves between 0 and 100. This indicator helps traders determine where a trend ends.
The stochastic oscillator is a useful indicator to evaluate the movement or strength of a trend. Stochastic oscillators and oscillators in general are presented in an easy and understandable way with clear buy and sell signals. However, over-reliance on these signals, without a deeper understanding of stochastic oscillators, is likely to lead to frustration. To avoid such frustration, new traders must have a thorough understanding of the underlying mechanics of the stochastic oscillator in relation to current market conditions.
The stochastic oscillator measures price movement. Momentum is the amount of acceleration in price movement. The idea behind the stochastic indicator is that the price of an instrument often changes before the price of the instrument changes direction. As a result, this indicator can be used to predict the reverse trend. Experienced traders and those who learn technical analysis can use the stochastic indicator. With the help of other technical analysis tools such as moving averages, trend lines, and support and resistance levels, the stochastic oscillator can help improve the accuracy of trades and identify profitable entry and exit points.
How does the stochastic indicator work?
This indicator works by focusing on the closing price of an instrument in relation to the high and low price range in a certain number of previous periods. Typically, the previous 14 courses are used. By comparing the closing price with the previous price movements, the indicator tries to predict the price return points.
A stochastic indicator is a two-line indicator that can be applied to any graph. It fluctuates between 0 and 100. This index shows how the current price is compared to the highest and lowest price levels in a predetermined period of the past. The previous course usually consists of 14 separate courses. For instance, in the weekly chart, this would be 14 weeks. In the hourly chart, this will be 14 hours.
When a stochastic marker is applied, a white line appears below the chart. This white line is the K line. There also a red line will be on the chart.
When the stochastic indicator is at a high level, it means that the price of the instrument is close to above the 14-period range. When the indicator is at a low level, it indicates that the price has closed near the end of the 14-day range.
The general rule for the stochastic indicator is that in a bullish market, prices are close to the highest price. In contrast, in a declining market, prices close. If the closing price moves away from the top or bottom, it indicates that the movement is slowing down.
Stochastic index can be used to identify overbought readings. It can also predict trend changes. Traders use various strategies with this indicator.
This indicator is more effective in broad trading intervals or slow trends.
How to read the stochastic indicator
This indicator is scaled between 0 and 100. Readings above 80 indicate that the instrument is trading close to its high and low range. A reading below 20 indicates that the instrument is trading near its lowest uptrend range.
Readings above 50 indicate that the instrument is trading at the top of the trading range. Readings below 50 indicate that the instrument is trading in the lower part of the trading range. When the stochastic lines are above 80, the indicator indicates that the tool has been purchased too much. When the stochastic lines are below 20, it indicates overselling of the tool.
Excessive buying and selling levels are useful for predicting trend changes. If a stochastic indicator falls from above 80 to below 50, it indicates that, the price is moving lower. If the indicator moves below 20 to above 50, it indicates a price increase.
Traders are also looking for divergence. This is when the stochastic trend line and the price trend line diverge. This indicates that the price trend is weakening and may be reversed soon.
How to trade using stochastic indicator in trading
These are the more common strategies utilizing Stochastic Indicator:
Stochastic overbought/oversold strategy
In an initial oversold strategy, traders can use a stochastic indicator to identify the entry and exit points of the trade.
In general, traders are looking to buy and sell when an instrument is oversold. The buy signal is often given when the stochastic indicator is below 20 and then reaches above 20. In contrast, traders are looking for a sell trade that is an over-bought tool. The sell signal is often given when the stochastic indicator is above 80 and then falls below 80.
However, excessive sales tags can be misleading. The price of a tool does not necessarily decrease due to its excessive purchase. Likewise, the price of a tool does not increase automatically just because it sells too much. Over-buying and over-selling means that the price is traded near the top or bottom of the range. This can keep on for a while.
Stochastic divergence strategy
Another popular trading strategy using a stochastic indicator is the divergence strategy. In this strategy, traders seek to see if the price of a tool is reaching a peak or the lowest price, whereas a stochastic index is not. This may indicate that the trend may be reversed.
An upward divergence occurs when the price of an instrument falls lower but touches a lower stochastic index. This indicates that the selling pressure has decreased and an upside reversal may occur. Downward divergence occurs when the price of an instrument reaches its highest point, but the stochastic index reaches its lowest point. This indicates that the uptrend has slowed down and a downward reversal may occur.
An important point about a divergence strategy is that no trading should take place until the divergence is confirmed by the actual price rotation. The price of a tool can continue to rise or fall for a long time, even when divergence occurs.
Stochastic crossover
Stochastic crossover is another popular strategy used by traders. This happens when the two lines intersect in an area where there is too much buying or selling.
When a rising K line crosses the top of the D line in the oversold area, it generates a buy signal. This is a sell signal when K line crosses below the D line in the overbought area. These signals are more reliable in limited markets. They are less reliable in popular markets. In a trend-following strategy, traders will monitor the stochastic indicator to make sure it is moving in one direction. This shows that this trend is still valid.
Stochastic bull/bear strategy
Finally, another common use of the stochastic indicator is to identify cattle and bear trading settings. Adjusting bull trades occur when the stochastic indicator peaks but the instrument price peaks lower. This indicates that momentum is increasing and the price of the tool can go up. Traders are often looking to buy after a short price reversal in which the stochastic indicator in the reversal has reached below 50 and then moves up again.
The bearish adjustment occurs when the stochastic indicator shows a lower, yet the price of the instrument falls lower. This indicates that sales pressure is increasing and tool prices may decrease. Traders are often looking to trade after a short return. Traders should be aware that the stochastic indicator has its limitations. This is not a safe technical analysis tool. Markers can often produce incorrect signals. In a turbulent market, this can happen often.
Cons of Stochastic Oscillator
The primary limitation of a stochastic oscillator is that it is known to produce incorrect signals. This is when the indicator generates a trading signal, but the price is not really followed, which can lead to a losing trade. In a volatile market, this can happen quite regularly. One way to help this is to consider the price trend as a filter, where signals are only received if they are in the same direction.
In conclusion
The Stochastic Oscillator is a popular and widely used momentum indicator. Traders often use divergent signals from the oscillator to identify potential market reversals. However, the oscillator is prone to producing incorrect signals. So, it is better to use it along with other technical indicators than as an independent source of trading signals.
Webull offers low expenses without holding back on innovative trading tools; but it may not be the best business for novices or hands-off financial backers.
Day trading is buying and selling of a similar security during a similar trading meeting to take little, continuous benefits. Sometimes traders trade options, meaning they choose when to open and close exchanges in view of current economic situations and instincts. Others are system dealers who adhere to a foreordained arrangement of guidelines to put exchanges. Traders utilize brokers and methods like Webull day trading to boost their trades.
What is Webull?
Webull is an exchanging platform that, somehow or another, intently looks like Robinhood. The organization was established in 2017, meaning it is more up to date to the financier business than customary players like Charles Schwab and Fidelity and advanced just platforms like Robinhood, which was established in 2013, and Coinbase.
Webull, which is claimed by Chinese holding organization Fumi Technology, permits clients to trade a scope of various speculations, including stocks, ETFs, options, and digital forms of money like Bitcoin, Dogecoin, and Shiba Inu coin.
The organization had multiple million-business clients as of December of 2020, Bloomberg News revealed. While that is still a lot more modest than Robinhood’s almost 19 million, Webull guaranteed to Bloomberg that it was taking clients from Robinhood. (Webull declined to remark on its present number of clients, and Robinhood did not answer to Money’s solicitation for input.) Robinhood saw a huge drop in clients in the second from last quarter of 2021, with month-to-month dynamic clients down to 18.9 million contrasted with 21.3 million in the subsequent quarter.
Fees on Webull day trading
Webull day trading does not charge commissions for exchanging, including trading cryptos like Bitcoin and options exchanging. Sans commission exchanging was promoted by Robinhood, and presently it is the business standard, even among customary financiers like Charles Schwab and Fidelity. You actually may see tiny expenses, as $0.02 per exchange, from administrative organizations like the Securities and Exchange Commission (SEC) and the Financial Industry Regulatory Authority (FINRA), as per Webull’s site.
By the by, even no-commission platforms need to bring in cash some way or another. Webull does it this way:
Installment for request stream
Exchanging applications brings in cash from high-velocity brokers to whom they course clients’ requests in this questionable yet normal practice.
Stock advances for Webull day trading
A few financial backers take part in a training called short offering; a method for wagering an organization’s stock cost will drop. Webull brings in cash by advancing out financial backers’ portions to short vendors, who then, at that point, offer those acquired offers to outsider financial backers, expecting to repurchase them later at a lower cost.
Interest on free credit adjusts
A free credit balance is a cash a specialist needs to pay you on request, similar to the money you put into a record or profits. Businesses bring in cash off the inactive money sitting in your record by loaning it out to outsiders and gathering revenue.
Edge interest
Clients with something like $2,000 have the choice to open an edge account in which they can acquire cash to purchase stocks. This gives clients purchasing power, yet in addition, opens them to a more serious gamble. Webull charges revenue consistently and the edge is not entirely set in stone by the size of the edge credit. For instance, a charge total up to $25,000 has a yearly edge pace of 6.99%.
Fundamental U.S. market information is free on Webull, however, the exchanging platform likewise offers more inside and out market information with what it calls Level 2 Advance, an organization with NASDAQ that clients can buy into for $1.99 every month. With the membership, clients can all the more likely decide the accessibility or interest for stock at a specific value, as per Webull’s webpage.
Is Webull day trading reliable?
Webull day trading has gotten an F rating with the Better Business Bureau. The BBB utilizes a grade scope of A+ to F while rating organizations, so this score shows that Webull is not dominating in its client connections. The BBB additionally says on its site that its evaluations do not ensure whether an organization will be dependable or perform well. Its appraisals fundamentally consider client objections. It is ideal to address any outstanding concerns prior to settling on a conclusion.
As indicated by its site, the BBB has given Webull an F because of its interest in the organization’s strategic approaches. The authority likewise ascribes this rating to the way that Webull has neglected to answer to and resolve client grumblings.
Prior in 2021, Webull additionally (alongside Robinhood, TD Ameritrade, and different businesses) briefly confined exchanging on Gamestop (GME), AMC Entertainment (AMC), and various different stocks whose costs soar because of a Reddit-related short press. This inspired a great deal of client kickback, yet the venture application in the end continued exchanging of the stocks.
Is Webull day trading possible?
Indeed, Webull day trading permits clients to day exchange – the demonstration of trading a similar security around the same time – on its application. Notwithstanding, there are two things that anybody looking day exchange stock has to know first: the PDT rule and request types.
PDT Rule
The Pattern Day Trader or PDT rule is an assignment from the SEC that constrains you to keep at least $25,000 in your exchanging account assuming you need to day exchange multiple times each week.
While the PDT rule is one the most baffling things you will experience while looking to day exchange, there are exactly couple of ways of exploring around it and there are likewise ways you can work inside the standard.
Request Types
Brokers additionally need to find out about the different request types they will use while day exchanging with Webull and see how to utilize them appropriately. This financier offers a variety of request types on its foundation.
The most widely recognized kinds of orders will find on the application are limit purchase, limit sell, market purchase, market sell, stop misfortune, purchase stop, purchase stop limit, sell stop limit, following stop limit request, and following stop misfortune.
Advantages and disadvantages of Webull day trading
These are the main day trading pros and cons of Webull day trading:
Simple to-utilize platform
New merchants may be overpowered by the various screens, diagrams, graphs, and pointers accessible on Webull application, yet somebody with even a tad of involvement can rapidly start to sort out it on account of its smooth, quick, and effortlessly controlled interface. The instruments accessible on the platform give experiences and data to assist dealers with making exchanges that are more productive. You can use them to perform both specialized and basic examinations.
Zero commissions in Webull day trading
Like all top markdown businesses, Webull charges no commission for exchanging U.S stocks, options, and ETFs on its versatile platform. The zero commissions give new and unpracticed dealers a method for playing little ball and figuring out how to exchange effectively.
Paper exchanging test system
Webull likewise offers a high-level paper-exchanging platform that permits new and unpracticed dealers to work on exchanging utilizing virtual money. The intermediary holds everyday and week-by-week rivalries with financial awards on the platform, further demonstrating its devotion to the growing dealer.
Nevertheless, with experts come to the cons be whatever. A similar applies to Webull. Here are a few disadvantages of day exchanging with this intermediary.
Hardly any specialized pointers
Webull’s library of specialized pointers is seriously missing and offers just ten of the most famous markers, with a few notables like relative strength file (RSI) and ADX missing. The specialized markers right now accessible on its work area platform are outstanding moving normal, basic moving normal, Ichimoku cloud, Bollinger groups, Keltner channels, Volume, SAR, KDJ, VWAP, and MACD.
Second-rate stock screener
A stock screener ought to furnish you with a wide exhibit of various data in view of special standards and permit you to distinguish possible victors. Webull’s stock screener has restricted customization prospects and a couple of channels. Yet, it is very great to think about Robinhood, Webull’s fundamental opponent offers no stock screening abilities.
Absence of Hot Keys on App
One thing we generally advance for day exchanging is utilized the utilization of hotkeys. They permit you to get in and out of an exchange with the press of a button. The Webull App does not have hotkeys, notwithstanding, the Webull Desktop does.
Setting up Webull day trading
webull day trading settings are as follows:
Platform 1: Open a Webull account
To start day exchanging, you will have to open a Webull account. You can open a record through either your cell phone or your personal computer. Webull does not need a base store to open a record and offers new dealers a paper-exchanging highlight so you can work on exchanging with virtual cash.
You will have to enter your email address while opening a record at Webull to get a confirmation code and enter a secret key somewhere in the range of 8 and 20 digits. Whenever you have gotten and entered your confirmation code, you will be coordinated to a Webull page depicting their extra protection inclusion for clients and the financial backer assurance given by the Securities Investor Protection Corp. (SIPC).
After you have enrolled your record, you can download Webull’s work area or cell phone application. PCs require at least 320 megabytes of extra room for the application.
Platform 2: Log in to perform
You can now sign in to Webull’s exchanging application utilizing your email and secret phrase blend or your telephone number on the off chance that you have joined with your cell phone. You could likewise fit the bill to get a free 3-month membership to Webull’s Level 2 market information administration.
After effectively signing into Webull’s exchanging platform, simply press the button on the right half of the page that says “Open Trading.” U.S. – based dealers should approve their personality prior to financing an exchange account.
You will be approached to transfer photos of the two sides of your driver’s permit. On the off chance that you do not have a driver’s permit, you can in any case open a record with a substantial U.S. visa, a Social Security number (SSN), or an Individual Tax Identification Number (ITIN). Assuming you are a U.S. inhabitant, you can open a record with an E1, E2 E3, F1, H1B, H3, TN1, O1 or L1 visa.
Platform 3: Define your trading system.
Picking a reasonable day exchanging methodology can rely upon your personality and Webull day trading method. Recorded beneath are a portion of the more famous day exchanging procedures:
Scalping Webull day trading: If you’re leaned to pull the trigger frequently, you may be happy with utilizing a high-speed scalping method since it centers around benefiting from little cost changes. Most hawkers stand firm on footings for very little time and sell when the position shows a benefit. Misfortunes likewise are taken rapidly to diminish the gamble of additional misfortunes.
Breakouts Webull day trading: This technique might suit more persistent people and requires a foundation in the specialized investigation. Exchanging breakouts largely include accepting a situation when an outline design has been penetrated on the cost diagram.
News exchanging Webull day trading: Market cost movement regularly rotates around monetary news. For instance, an organization delivering an income report or an oil investigation firm that declares an oil disclosure makes a news occasion that could influence their stock’s cost after the news is delivered and even previously whenever reputed. Other news discharges like macroeconomic reports and financial pointers can influence the market overall and move individual stock costs.
Platform 4: Add assets to your record.
Webull has two subsidizing options whenever you have opened an exchange account:
ACH moves
Programmed Clearing House (ACH) moves include connecting a bank checking or investment account to your Webull account. To support a record with this choice, you give Webull a financial balance and steering numbers. After accepting your data, Webull then, at that point, sets aside 2 miniature installments of under $1 to your financial balance to confirm that you are truth be told on the ledger and can get to movement on it.
After you have been checked, you can put aside an ACH installment, which can commonly take up to 5 work days. Whenever you have started the store, Webull permits you to promptly involve a part of your store for exchange. Webull has an everyday store cutoff of $50,000 each day per account utilizing the ACH move strategy.
Wire moves
Webull acknowledges homegrown and worldwide wire moves to subsidize a record. An underlying expense of $8 is charged for the primary store, with ensuing stores charged at $12.50 per exchange under $25,000. For stores more than $25,000, Webull defers their expenses.
Ensure you check with your bank since most banks likewise charge an expense for active wires. Likewise, remember that no outsider wires are acknowledged. Homegrown wire moves take up to 2 work days to finish, while global wires take up to 5 work days to finish.
Platform 5: Consider virtual trading (discretionary) using Webull day trading
In the event that you are new to day exchanging, an incredibly involved method for getting the exchanging experience you really want is to utilize Webull’s paper exchanging highlight. You can trade stocks with no financial gamble by involving virtual cash in Webull’s free paper exchange account. This allows you to rehearse your day exchanging procedures, sharpen your cash the executive’s interaction and test your exchange plan.
Platform 6: Start live trading using a Webull day trading.
When you choose to begin live exchanging a supported record, the stocks you choose to day exchange relies totally upon your own examination. On the off chance that you expect to utilize a major investigation, you could start by choosing the loads of organizations you are now acquainted with. For instance, on the off chance that you have had proficient involvement with the semiconductor business, you should exchange the load of organizations engaged with semiconductor creation.
On the off chance that you have positively no experience exchanging stocks, you will have to get some schooling on how the securities exchange functions. You could likewise need to figure out how to utilize specialized investigation strategies to give objective exchanging signals you can fuse into an exchanging plan.
FAQs
Can we use Webull for day trading?
Of course, Webull allows customers to make day-to-day transactions – buying and selling identical securities on the same day – in their schedule.
Is it possible to trade 24/7 on Webull?
Webull upholds full expanded hours exchanging, which incorporates full pre-market (4:00 AM – 9:30 AM ET) and night-time (4:00 PM – 8:00 PM ET) meetings.
The Band Protocol is a new way of sharing data that has the potential to revolutionize the way we interact with the internet.
In today’s digital world, data is everything. There are many ways for companies to collect data and help them grow, but the problem has always been that the data which is collected from customers isn’t shared with the rest of the company. Band Protocol (BAND) is a new decentralized data oracle platform that provides services to multiple projects across different blockchains by allowing them to share their customer data in order to make informed decisions about their products and services.
Band Protocol is a decentralized data oracle platform that connects real-world data to smart contracts. Band Protocol is secured by a network of staking providers and provides fast and reliable data without the need for a centralized data aggregator.
How Does Band Protocol (BAND) Operate?
Band Protocol operates on a simple two-token system. The first token is the BAND token which is used to stake on validators to become a part of the network. The second token is the sUSD, which is the synthetic USD peg used within the Band Protocol ecosystem to pay for data requests, fees, and rewards.
The Band Protocol network consists of three types of nodes: Data Providers, Oracle Nodes, and Validators. Data providers are responsible for collecting off-chain data and submitting it to Oracles. Oracles are then responsible for verifying the data and packaging it into a format that can be read by smart contracts. Validators are responsible for verifying Oracles and maintaining the network.
Data providers are rewarded with sUSD for their contributions to the network, while Oracles and Validators are rewarded with both sUSD and BAND tokens for their services.
What are the Advantages of Band Protocol?
There are many advantages of using Band Protocol for data sharing. One advantage is that it allows for real-time data sharing between multiple parties. This means that data can be shared instantly, without having to wait for a centralized party to update their records. This facilitates quick and efficient communication between parties.
Another advantage of Band Protocol is that it is highly secure. Data is encrypted when it is shared using Band Protocol, so only the intended recipients will be able to access it. This ensures that sensitive information remains confidential.
Band Protocol also offers a high degree of scalability. It can be used by large organizations with thousands of users, as well as small groups. This makes it a versatile solution for data-sharing needs.
Finally, Band Protocol is easy to use. It has a simple interface that makes it straightforward to share data. This makes it an ideal solution for people who are not tech-savvy or who do not have time to learn complex systems.
What are the Disadvantages of Band Protocol?
There are a few potential disadvantages of using Band Protocol, including the risks associated with data quality and the reliance on a central party for data availability. Additionally, Band Protocol is still in its early stages of development and has yet to be widely adopted. As such, there may be more unknowns associated with using the protocol than with more established options.
How is Band Different from Other Data Sharing Platforms like Ethereum’s Oracles and Bitcoin’s Lightning Network?
Other data-sharing platforms like Ethereum’s Oracles and Bitcoin’s Lightning Network have their own strengths and weaknesses. For example, Ethereum’s Oracles are decentralized but slow, while Bitcoin’s Lightning Network is fast but centralized. Band Protocol is different in that it is both fast and decentralized.
With Band Protocol, data is stored on a network of nodes called validators. These validators stake BAND tokens to ensure the accuracy of the data they provide. If a validator provides inaccurate data, they will lose their stake. This incentive system ensures that validators have a vested interest in providing accurate data.
Overall, Band Protocol is a more scalable, secure, and easy-to-use platform than other data-sharing platforms like Ethereum’s Oracles and Bitcoin’s Lightning Network.
What Projects Have Already Opted in to Utilize BAND’s Services?
The protocol is powered by a native token, BAND, which is used to incentivize node operators to provide accurate data.
The Band Protocol has already been integrated into several projects, including:
CryptoKitties: CryptoKitties is a popular blockchain game that allows players to collect, breed, and trade virtual cats. The game utilizes the BAND Protocol to help verify the authenticity of in-game items.
Bounty0x: Bounty0x is a decentralized bounty-hunting network that allows users to post and complete bounties for rewards. The platform uses the BAND Protocol to help ensure that bounty hunters are paid accurately and promptly for their work.
U Network: U Network is a decentralized content publishing and distribution platform. The platform uses the BAND Protocol to help ensure that content creators are fairly compensated for their work.
Conclusion
The Band Protocol is a new way of sharing data that has the potential to revolutionize the way we interact with the internet. By allowing users to control their own data, the Band Protocol gives us a glimpse into a future where we are not at the mercy of large corporations or governments when it comes to our personal information. We are very excited about the potential of this technology and look forward to seeing how it develops in the coming years.
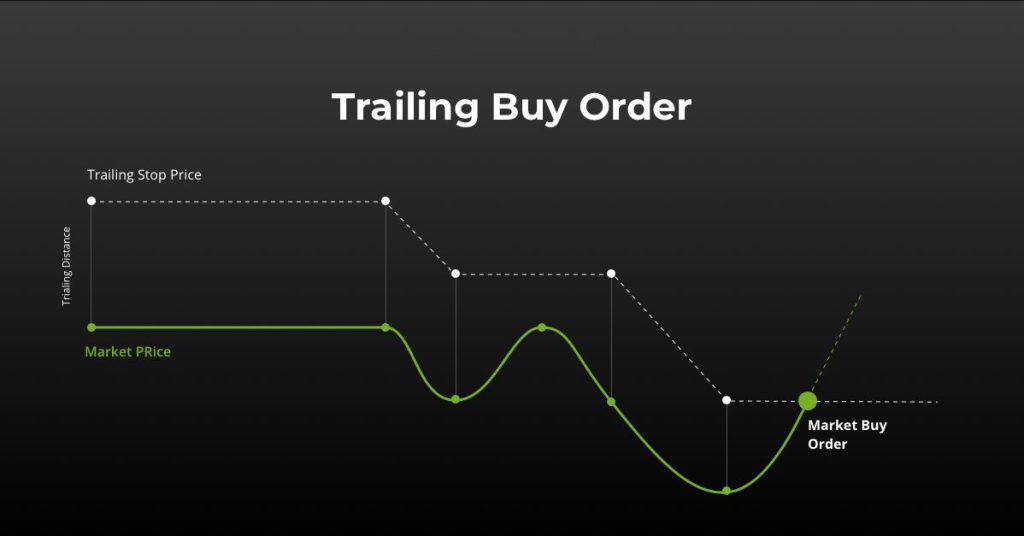
A trailing stop order is a type of order that automatically adjusts the stop price for an open position as the market moves in your favor.
A trailing stop order is a type of order that allows you to automatically protect your profits as the market moves in your favor. It is a dynamic order that “trails” your stop loss price along with the price of the security. As the security price rises, so does the stop loss price.
A trailing stop order is an order to buy or sell an asset at the best market price, but only after the market price has risen to a certain level. The order is placed at a fixed amount below the current market price and will automatically adjust to the market price as it rises.
If you place a trailing stop order for XYZ stock with a 10% trailing stop, your order will activate when the stock hits $90 and will fill at $81 (10% below $90).
How does a trailing stop order work?
As the stock price fluctuates, the stop price moves up or down accordingly, but never goes below the specified percentage. For example, if you place a 25% trailing stop on a stock currently trading at $100, and it rises to $120, your stop price would automatically adjust to $90 (25% below $120). If the stock then fell to $110, your stop would adjust to $82.50 (25% below $110), and so on.
What are the benefits of a trailing stop order?
This type of order is designed to protect investors from downside risk by allowing them to lock in profits as a stock price rises, while still allowing for upside potential.
There are several benefits of using a trailing stop order:
It can help you lock in profits on a rising stock price, while still allowing for upside potential.
t can help to minimize losses if the stock price falls suddenly.
It can take the emotion out of decision-making, as it automatically sells your shares once the stock reaches your predetermined target price.
Trailing stop orders can be placed with most brokers and are relatively simple to set up.
What are the risks of a trailing stop order?
The first risk is that the trailing stop may not be executed at the desired price if the market moves too quickly. This can result in losses if the market continues to move against the position. Another risk is that a sudden spike in volatility can cause the stop to be triggered and close out the position at a loss. Finally, if there is a gap in prices (such as overnight or during weekends), the stop may not be executed at the desired price, again leading to potential losses.
How to place a trailing stop order?
When you place a trailing stop order, you are essentially setting a stop loss order at a certain percentage below the market price. For example, let’s say you buy shares of Company XYZ at $50 per share. You could place a trailing stop order 10% below the market price, which would protect your downside if the stock price fell to $45 per share.
If the stock price instead rose to $60 per share, your trailing stop order would automatically adjust to 10% below the new market price, or $54 per share. That way, you would still have some upside potential while protecting your original investment.
Trailing stop orders can be placed with most online brokerages and are a helpful tool for investors who want to limit their downside risk while still participating in upward moves in the stock market.
Conclusion
A trailing stop order is a type of order that automatically adjusts the stop price for an open position as the market moves in your favor. This ensures that you lock in your profits as the market moves, and protects you from any sudden reversals. Trailing stop orders are a great way to manage your risks and maximize your profits in volatile markets.
The Merge Ethereum Upgrade is a great way to improve your blockchain experience. With improved features, you’ll be able to take your business to the next level.
The Ethereum network is set to upgrade once again, this time with a new hard fork called the Merge. This fork is scheduled to occur on January 11, 2019, at block number 7,080,000. The purpose of the merge is to provide a more stable and secure network by implementing several new features and improvements. One of the most notable changes is the introduction of zk-SNARKs, which will enable private transactions on the Ethereum network. In this blog post, we will explore all you need to know about the upcoming Merge hard fork, from its features and benefits to how it will affect users and miners. Stay tuned for all the latest updates!
The Merge upgrade is a proposed Ethereum Improvement Proposal (EIP) that would allow for the merging of ETH-based assets on the Ethereum blockchain. If successful, the Merge upgrade would enable users to combine their ETH-based assets into a single account, making it easier to manage and use them. The proposal has been designed to address some of the key limitations of the current Ethereum blockchain, namely its scalability and high transaction fees. If implemented, the Merge upgrade would improve Ethereum’s scalability by allowing users to combine their ETH-based assets into a single account.
This would reduce the number of transactions needed to be processed on the Ethereum blockchain, thereby reducing congestion and reducing transaction fees. In addition, the merge upgrade would also allow for the creation of new smart contracts and decentralized applications (dApps) that could take advantage of the increased scalability.
What Changes are Being Made?
The developers of Ethereum have been working on a major upgrade to the Ethereum network for over a year now. The upgrade, called the “Ethereum Merge”, is a hard fork of the Ethereum blockchain that will result in two separate chains: one that supports the new features and one that does not. This article will explain what changes are being made with the Ethereum Merge and how it may impact you.
The primary change being made with the Ethereum Merge is the introduction of a new way of consensus called “Proof of Stake” (PoS). PoS is different from the current consensus algorithm, “Proof of Work” (PoW), in several ways. PoW requires miners to expend computational resources in order to validate blocks, while PoS only requires users to hold ETH in order to participate in block validation. This difference could lead to increased security and efficiency for the Ethereum network.
In addition, the Ethereum Merge will also introduce some changes to smart contract functionality. These changes are designed to make it easier for developers to create and deploy contracts on the Ethereum network. Finally, the merge will include a number of smaller improvements and bug fixes.
For more information about the upcoming Ethereum Merge, please check out our other articles or visit https://ethereumclassic.github.io/.
When is the Upgrade happening?
The “user experience” would be given top priority during the entire user transfer process, according to Vitalik Buterin’s migration plan, which was made public in October 2019.
This upgrade has been years in the making and is a critical step in Ethereum’s development. It includes a number of important changes and improvements, including increased security, improved performance, and more.
For more details on the Byzantium hard fork and what it entails, please see our blog post: The Merge Ethereum Upgrade: All You Need To Know.
How will this Affect Miners and Full Nodes?
The proposed merge of Ethereum and Ethereum Classic would have a major impact on miners and full nodes. The new chain would be incompatible with the existing Ethereum network, meaning that miners would have to choose which chain to mine on. This could lead to a split in the community, with some miners switching to the new chain and others staying on the old chain. Full nodes would also be affected, as they would need to upgrade to the new chain in order to remain compatible. This could cause a temporary disruption in service as users to upgrade their nodes.
What does this mean for Ethereum Users?
The long-awaited merge between the Ethereum and Bitcoin blockchains is finally happening. But what does this mean for users of each currency?
For Ethereum users, the most significant change will be the switch from a Proof of Work (PoW) to a Proof of Stake (PoS) consensus algorithm. This change will make it easier for people to validate transactions on the Ethereum blockchain and earn rewards for doing so. Additionally, the merge will bring increased security to the Ethereum network and make it more scalable.
For Bitcoin users, the main change will be the ability to use smart contracts on the Bitcoin blockchain. This will open up a whole new world of possibilities for Bitcoin and could make it much more widely used in the future. Additionally, the merge will increase the security and scalability of the Bitcoin network.
Conclusion
The Merge Ethereum Upgrade is a great way to improve your blockchain experience. With the new and improved features, you’ll be able to take your business to the next level. Be sure to check out all the details so that you can make the most informed decision possible.
A limit order is a type of stock order that allows investors to specify the price they are willing to pay for a security.
A limit order is an order to buy or sell a security at a specified price or better. A buy limit order can only be executed at the limit price or lower, and a sell limit order can only be executed at the limit price or higher. A limit order is not guaranteed to execute. If the security’s market price does not reach the limit price, the order will remain open until it is canceled by the customer, or until the end of the trading day, whichever comes first.
When you place a limit order, you’re telling your broker that you only want to buy or sell a security at a certain price. A limit order isn’t executed until the security reaches the specified price. Buying securities with a limit order is sometimes called taking a position.
There are two types of limit orders:
Buy limit orders: You instruct your broker to buy security only when it reaches a certain price. This is also called a take-profit order.
Sell limit orders: You instruct your broker to sell a security only when it reaches a certain price.
The benefits of a Limit order
A buy limit order can only be executed at the limit price or lower, and a sell limit order can only be executed at the limit price or higher.
Limit orders give traders and investors more control over their entries and exits, and they are particularly useful in volatile markets. They can also help to ensure that you get the best possible price for your trade.
There are a few key benefits of using limit orders:
1. You Can Control the Price You Pay (or Sell For)
With a limit order, you specify the exact price you want to pay (or sell for), so you will never pay more (or receive less) than that amount. This is in contrast to market orders, which are filled at the best available price at the time the order is placed. In a fast-moving market, this could mean paying significantly more (or receiving less) than you had intended.
2. Limit Orders Help You Manage Risk
By specifying the exact price you want to pay (or sell for), limit orders help you manage your risk because you know exactly what worst-case scenario you’re comfortable with before you place your trade. With a market order, on the other hand, there is always the potential for slippage, which could result in losses if the market moves against you.
3. Limit Orders Can Help Ensure That Your Trade
The drawbacks of a Limit order
A limit order is an order to buy or sell a security at a specified price or better. A limit order is not guaranteed to be executed.
There are a few drawbacks to using limit orders:
It’s possible that the security will never reach the specified price, in which case the order will never be executed.
If the security does reach the specified price, there’s no guarantee that it will stay there long enough for the order to be filled.
It’s also possible that the security will reach the specified price and then quickly drop below it, in which case you’ll miss out on getting the best possible price.
How to place a limit order?
If you want to buy or sell shares at a specific price, you can place a limit order. This ensures that you won’t pay more than a certain amount for a stock, or sell for less than a certain amount.
A limit order is an order to buy or sell a security at a specified price or better. A buy limit order can only be executed at the limit price or lower, and a sell limit order can only be executed at the limit price or higher.
To place a limit order, you’ll need to enter the following information into your online broker’s trading platform:
The stock ticker symbol
The number of shares you want to buy or sell
The limit price (the maximum amount you’re willing to pay per share, or the minimum amount you’re willing to accept per share)
The duration of the order (good ’til canceled [GTC] vs. day only)
Once you’ve entered all the pertinent information, hit “submit” and your order will go through.
When to use a Limit order?
When it comes to placing trades, there are generally two order types that investors use: market orders and limit orders. Market orders are the most commonly used type of order, as they simply involve buying or selling a security at the best available price. Limit orders, on the other hand, are more complex and require a bit more strategic planning.
So, when is it appropriate to use a limit order? Generally speaking, limit orders are best used when an investor has a specific price target in mind for a stock purchase or sale. For example, let’s say you wanted to buy shares of ABC Corporation at $10 per share. If the current market price for ABC Corporation is $12 per share, you would place a limit order to buy shares of ABC Corporation at $10 per share. Your order would then be executed once ABC Corporation’s share price dropped to your specified limit price of $10.
There are also times when an investor may want to place a limit order in order to protect against downside risk. For instance, if you already own shares of XYZ Company and its stock is currently trading at $50 per share, you might place a sell limit order for XYZ Company at $48 per share. This way, if the stock price falls below your specified limit price, your shares will automatically be sold and you’ll lock in a small profit. However, if the stock price doesn’t fall below your limit price, your shares will continue to be owned by you.
Conclusion
A limit order is a type of stock order that allows investors to specify the price they are willing to pay for a security or the price at which they are willing to sell it. This type of order can help you get the best possible price for your shares, but it is important to remember that there is no guarantee that your order will be filled. If you have any questions about limit orders, or if you’re not sure whether this type of order is right for you, be sure to speak with a qualified financial advisor.
From the article, we can see that Tesla token is a very interesting project with a lot of potential.to see and read more, follow us.
This article examines the Tesla Token and provides an overview of the project as well as a brief history. Furthermore, it will explore the token’s use cases and look at some of the price action over the last few months.
What is Tesla Token?
Tesla Token is a cryptocurrency that was created in 2014. It is based on the blockchain technology and has a total supply of 21 million tokens. Tesla Token is different from other cryptocurrencies because it uses a unique algorithm that allows for faster transaction times and lower fees. Tesla Token is also inflation-proof, meaning that its value will not decrease over time like other currencies.
Why is Tesla Token the best bet in crypto?
Tesla Token is the best bet in crypto because it has a number of unique features that make it a strong investment. First, Tesla Token is backed by a real asset – Tesla stock. This gives it a level of stability that other coins don’t have. Secondly, Tesla Token is deflationary, meaning that there will only ever be a limited supply of tokens. This makes it a good long-term investment, as the value of the token is likely to increase over time. Finally, the team behind Tesla Token are experienced and have a good track record in the crypto space. They’re also transparent and communicative, which gives investors confidence in the project.
If you’re looking to get involved in trading Tesla, there are a few things you need to know. First, Tesla is a publicly traded company, so you can buy and sell shares of its stock through a broker. However, Tesla also has its own cryptocurrency, called the Tesla Token.
The Tesla Token is based on the Ethereum blockchain and can be bought and sold on cryptocurrency exchanges. You’ll need to set up an account with a exchange and deposit some funds before you can start trading.
Tesla Tokens can be used to purchase goods and services from Tesla or any other company that accepts them. You can also hold onto your tokens as an investment, since they have the potential to increase in value over time.
If you want to get started trading Tesla, the best thing to do is research the market and find a reputable exchange to trade on. Once you’ve done that, you can start buying and selling Tesla Tokens just like any other cryptocurrency.
Trading Tesla Tokens on EtherDelta
EtherDelta is the leading decentralized exchange for trading Ethereum-based tokens. It is the most popular venue for trading Tesla Tokens, with over $1 million worth of Tesla Tokens traded on the platform in the past 24 hours.
EtherDelta offers a variety of benefits for traders, including:
Decentralized: EtherDelta is a decentralized platform that runs on smart contracts, meaning it is not subject to the whims of centralized exchanges. This makes it more resilient to hacks and makes it possible to trade 24/7.
User-friendly: EtherDelta has a straightforward interface that is easy to use, even for first-time crypto traders.
Token Selection: EtherDelta offers a wide selection of Ethereum-based tokens, making it the ideal place to trade Tesla Tokens.
If you’re looking to trade Tesla Tokens, EtherDelta is the best place to do it. With a user-friendly interface and a wide selection of tokens, EtherDelta is the leading decentralized exchange for trading Ethereum-based tokens.
How can I make money predictions with Tesla Tokens?
If you’re looking to make money predictions with Tesla Tokens, there are a few things you need to know. First, Tesla Tokens are a new type of cryptocurrency that is based on the blockchain technology of Bitcoin. This means that Tesla Tokens can be used to purchase goods and services just like Bitcoin, but they also have the added benefits of being faster and more secure.
Second, because Tesla Tokens are still in their early stages, they are highly volatile. This means that their value can go up or down very quickly, so it’s important to keep an eye on the market before making any decisions.
Third, when making predictions about the future value of Tesla Tokens, it’s important to remember that this is a long-term investment. The value of Tesla Tokens could increase or decrease over time, so it’s important to think about your goals and timeframe when making predictions.
Overall, if you’re looking to make money predictions with Tesla Tokens, it’s important to do your research and understand the risks involved. However, if you’re willing to take on those risks, Tesla Tokens could be a great way to make some serious profits in the future!
Conclusion
From the article, we can see that Tesla token is a very interesting project with a lot of potential. The team behind it is very experienced and has a lot of good things to say about the project. However, there are also some risks associated with it, so investors should be cautious before investing in this project.
Lido Coin is a digital asset that was created to provide a more efficient way to trade and invest in the crypto market. To see and read more, follow us.
Lido (LDO) is a digital asset that was created to provide a more efficient way to trade and invest in the crypto market. The Lido team developed a unique algorithm that allows users to get the most accurate prices for their desired assets. This system also makes it possible to automatically trade and invest without the need for manual intervention.
Lido is a decentralized protocol for staking and governance that enables users to earn a yield on their digital assets. The protocol is designed to be scalable, secure, and easy to use. It is used to power the ecosystem and incentivize participation in the network. Holders of Lido can participate in staking and governance, and earn a yield on their tokens.
The Lido Protocol is designed to be scalable, secure, and easy to use. It is powered by the Lido token, which is used to incentivize participation in the network. Holders of Lido can participate in staking and governance, and earn a yield on their tokens.
How to buy Lido (LDO)?
Lido is a new cryptocurrency that promises to revolutionize the way we interact with the digital world. Here’s everything you need to know about Lido and how to buy it. To buy Lido you can use Kucoin. Click on the button below:
Assuming you have already bought your Lido, you will need to store them in a digital wallet. There are many different types of wallets available, but we recommend using either the official Lido Wallet or Trust Wallet.
Once you have downloaded and installed your chosen wallet, open it up and create a new account. Then, simply follow the instructions provided by the wallet to add your Lido. Once they have been successfully added, your coins will be safe and secure in your digital wallet.
What are the benefits of Lido (LDO)?
Perhaps the most notable benefit of Lido is its decentralization; because Lido is not subject to government or financial institution control, it can be used by anyone, anywhere in the world. This also makes Lido more resistant to inflation than fiat currencies, as there is no central authority that can manipulate the money supply. Additionally, Lido transactions are fast and secure, thanks to the blockchain technology that powers the currency.
Conclusion
Lido is a new cryptocurrency that offers a unique way to earn rewards. It is based on the Proof of Stake algorithm and provides a variety of benefits that make it an attractive option for investors. In addition, Lido has a strong team of developers who are committed to creating a secure and user-friendly platform.