Technical analysis is a popular method used by traders to analyze financial markets. One of the key tools used in technical analysis is chart patterns. Chart patterns are formed by the price action of an asset over time and can be used to identify potential trading opportunities. The descending triangle pattern is one of the most powerful chart patterns in financial markets. In this guide, we will explore the characteristics of the descending triangle pattern, its formation, and how traders can use it to generate trading signals.
You can also read: What is HNT (Helium) and How Does it Work?
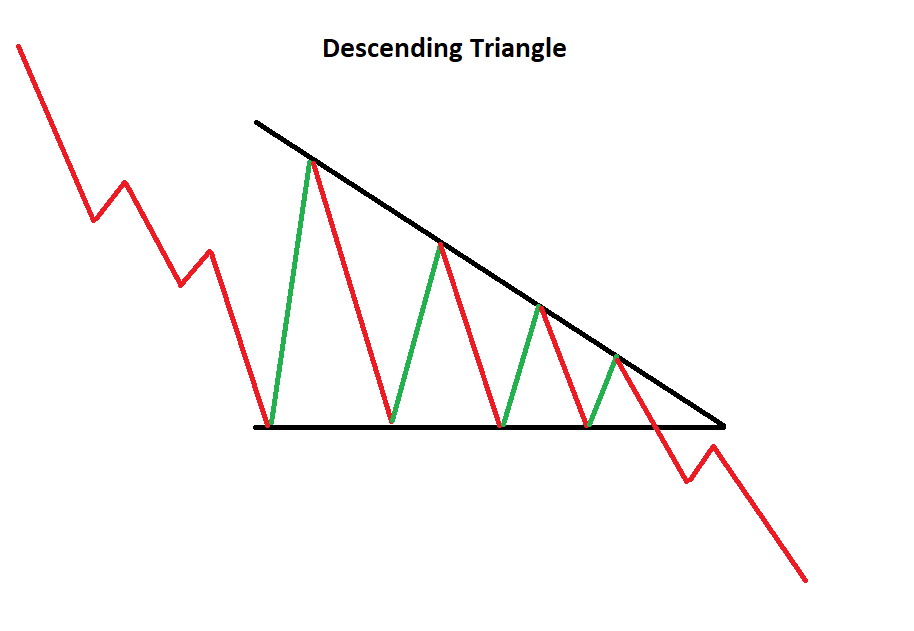
What is a Descending Triangle Pattern?
A descending triangle pattern is a bearish chart pattern that is formed by a series of lower highs and a horizontal support level. The pattern is characterized by a series of lower highs that form a descending trendline and a horizontal support level that forms the base of the triangle. The descending triangle pattern is considered a bearish pattern because it suggests that sellers are gradually gaining control of the market, and the price is likely to continue to move lower.

Identifying a Descending Triangle Pattern
A descending triangle pattern is formed when the price of an asset is making a series of lower highs and is unable to break through a horizontal support level. Traders will typically look for at least two points of contact with the support level to confirm that it is a valid level of support. As the price continues to make lower highs, it creates a descending trendline that converges with the horizontal support line to form the triangle pattern.
When the price breaks below the support level, it is considered a bearish signal, and traders may look to enter short positions or sell their long positions. The target for the trade is typically the height of the triangle pattern measured from the support level to the highest point of the descending trendline.
Key Characteristics of a Descending Triangle Pattern
There are several key characteristics of a descending triangle pattern that traders should be aware of:
- Lower Highs: The pattern is characterized by a series of lower highs that form a descending trendline.
- Horizontal Support Level: The pattern is formed by a horizontal support level that acts as the base of the triangle.
- Converging Trendlines: The descending trendline and the horizontal support level converge to form the triangle pattern.
- Bearish Signal: When the price breaks below the support level, it is considered a bearish signal, and traders may look to enter short positions or sell their long positions.
- Target for the Trade: The target for the trade is typically the height of the triangle pattern measured from the support level to the highest point of the descending trendline.
Strategies for Trading with a Descending Triangle Pattern
A descending triangle pattern is a bearish chart pattern that can be used by traders to identify potential selling opportunities. It is formed by a horizontal support level and a series of lower highs that form a descending trendline. In this guide, we will explore some strategies for trading with a descending triangle pattern.
Identifying a Descending Triangle Pattern
The first step in trading with a descending triangle pattern is to identify the pattern. Traders should look for a horizontal support level that has been tested at least twice and a series of lower highs that form a descending trendline. The descending trendline should be sloping downwards and should be parallel to the horizontal support level. Once the pattern has been identified, traders can look for potential selling opportunities.
Strategy 1: Breakout Trading
One strategy for trading with a descending triangle pattern is breakout trading. Breakout trading involves waiting for the price to break below the horizontal support level before entering a short position. When the price breaks below the support level, it is considered a bearish signal, and the price is likely to continue to move lower.
Traders should wait for the price to close below the support level before entering a short position. They should also place a stop loss above the descending trendline to limit their losses in case the price moves against them.
The profit target for the trade can be determined by measuring the height of the triangle pattern and subtracting it from the breakout point. This will give traders an idea of how far the price may move after the breakout.
Strategy 2: Pullback Trading
Another strategy for trading with a descending triangle pattern is pullback trading. Pullback trading involves waiting for the price to pull back to the descending trendline before entering a short position. When the price pulls back to the trendline, it is considered a selling opportunity, and the price is likely to continue to move lower.
Traders should wait for the price to touch or come close to the descending trendline before entering a short position. They should also place a stop loss above the descending trendline to limit their losses in case the price moves against them.
The profit target for the trade can be determined by measuring the height of the triangle pattern and subtracting it from the entry point. This will give traders an idea of how far the price may move after the pullback.
Strategy 3: Moving Average Crossover
Another strategy for trading with a descending triangle pattern is the moving average crossover. This strategy involves using two moving averages of different periods to generate buy and sell signals.
Traders can use a shorter-term moving average, such as a 10-day moving average, and a longer-term moving average, such as a 50-day moving average. When the shorter-term moving average crosses below the longer-term moving average, it is considered a bearish signal, and traders may look to enter a short position. When the shorter-term moving average crosses above the longer-term moving average, it is considered a bullish signal, and traders may look to exit their short position or enter a long position.
Traders should also look for the descending triangle pattern to confirm the sell signal. When the price breaks below the support level, it confirms the bearish signal generated by the moving average crossover.
Benefits of Using an Ascending Triangle Pattern
- Easy to Identify: The descending triangle pattern is easy to identify and can be used by traders of all levels.
- High Probability: The descending triangle pattern has a high probability of success, as it is a reliable bearish pattern.
- Clear Entry and Exit Signals: The pattern provides clear entry and exit signals, making it easier for traders to manage their trades.
- Defined Risk and Reward: The pattern provides traders with a defined level of risk and reward, making it easier to manage their trades.
Drawbacks of Trading the Descending Triangle Pattern
- False Signals: Like all chart patterns, the descending triangle pattern can produce false signals, which can result in losses for traders.
- Limited Timeframe: The pattern is a short-term pattern and may not be suitable for traders who prefer longer-term trading strategies.
- Limited Profit Potential: The profit potential for the trade is limited to the height of the triangle pattern measured from the support level to the highest point of the descending trendline.
In conclusion
The descending triangle pattern is a powerful bearish chart pattern that can be used by traders to generate trading signals. The pattern is characterized by a series of lower highs and a horizontal support level that converges to form a triangle pattern. When the price breaks below the support level, it is considered a bearish signal, and traders may look to enter short positions or sell their long positions. The target for the trade is typically the height of the triangle pattern measured from the support level to the highest point of the descending trendline. While the pattern has its advantages and disadvantages, it is a reliable pattern that can be used by traders of all levels to identify potential trading opportunities.