Have you heard of the Dow Theory, but are unsure exactly what it means for your investments? Look no further! In this blog post, we will delve into the Dow Theory and break down each stage of market trends to help you better understand the ebb and flow of the stock market. Whether you’re a seasoned investor or just getting started, understanding these trends can help inform your investment decisions and maximize returns. So let’s dive in!
You can also read: Tracking Your Crypto Profits with Cryptotrader
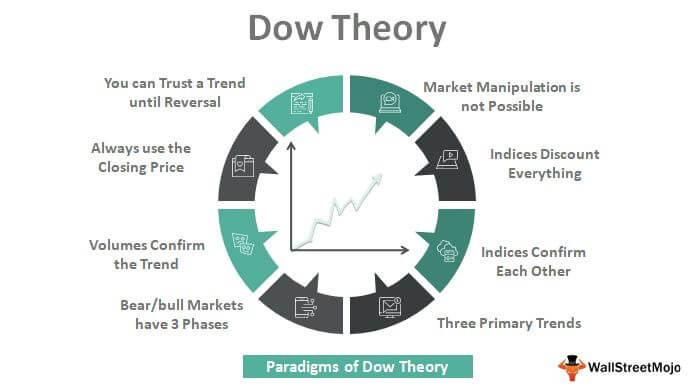
Introduction to the Dow Theory
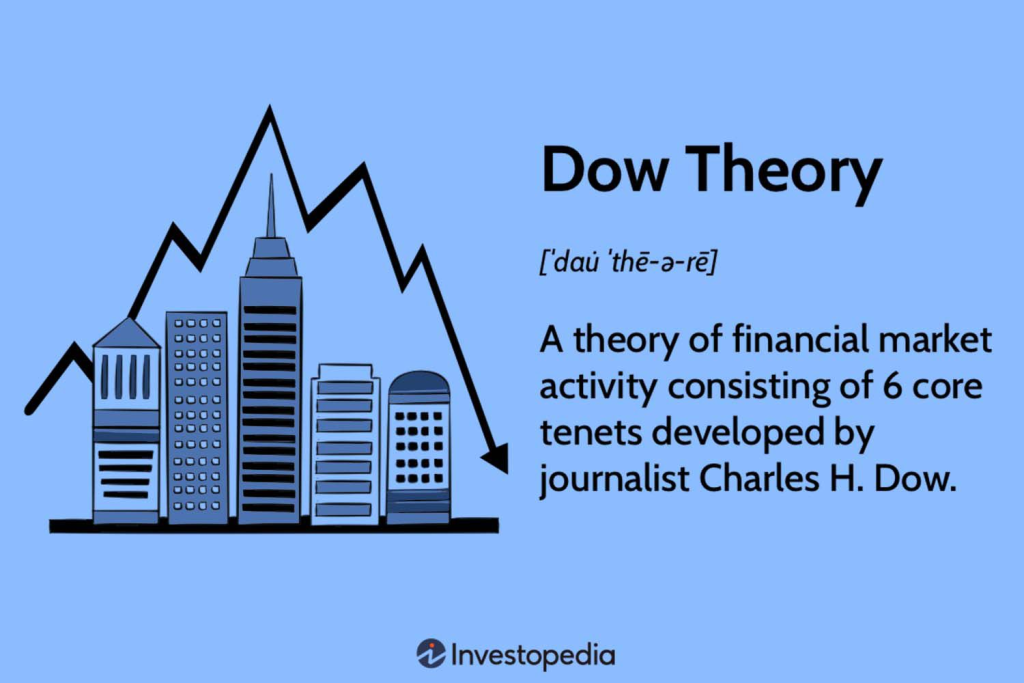
The Dow Theory is one of the most popular and well-known market theories. It was developed by Charles Dow, co-founder of The Wall Street Journal, and it states that there are three different stages of market trends: primary, secondary, and tertiary.
Three Stages of Market Trends
The theory was developed by Charles Dow, co-founder of The Wall Street Journal, in the late 19th century. The Dow Theory states that there are three different stages of market trends: primary, secondary, and tertiary.
Primary trends are the overall direction of the market. They can last for months or even years, and are typically driven by major economic factors such as interest rates, inflation, and GDP growth.
Secondary trends are shorter-term movements within primary trends. They can last for weeks or months, and are typically driven by news events or technical factors.
Tertiary trends are even shorter-term movements within secondary trends. They can last for days or weeks, and are often driven by noise or randomness.
Primary Trend
The Dow theory is a market analysis tool that was developed by Charles Dow, co-founder of the Wall Street Journal. The theory states that there are three different stages of market trends: primary, secondary, and tertiary.
The primary trend is the overall direction of the market. This can be either up, down, or sideways. The secondary trend is a shorter-term movement that goes against the primary trend. For example, if the primary trend is up, the secondary trend might be down. And finally, the tertiary trend is an even shorter-term movement that goes against the secondary trend.
So, in order to identify the primary trend of the market, you need to look at the longer-term picture. This means looking at charts with a time frame of at least 6 months. Once you have identified the primary trend, you can then look for opportunities to trade in the direction of that trend using shorter time frame charts.
Secondary Trend
The secondary trend is a shorter-term trend that lasts anywhere from a few weeks to a few months. This trend is typically a corrective move within the primary trend and is used by traders to enter and exit trades. The key to identifying the secondary trend is to look for changes in market momentum.
Minor Trend
There are three stages of market trends: primary, secondary, and minor. Minor trends are the shortest and most difficult to spot of the three. They typically last between two and three weeks, during which time the market fluctuates erratically.
The most important thing to remember about minor trends is that they are part of a larger trend. Therefore, they should not be traded against. For example, if the overall market trend is upward, then a short-term downtrend should be viewed as an opportunity to buy rather than a sign that the market is about to crash.
Minor trends can be tricky to spot, but they are important to understand in order to trade successfully. Pay attention to overall market trends and use them to your advantage when trading during a minor trend.
Advantages and Disadvantages of the Theory
There are many different interpretations of the Dow Theory, but the basic idea is that market trends have three different stages: bull markets, bear markets, and consolidation periods. Each stage has its own advantages and disadvantages.
Bull markets are characterized by rising prices and optimistic investor sentiment. The main advantage of bull markets is that they offer the opportunity to make profitable investments. However, there is also a downside to bull markets: they can be followed by sharp corrections or even bear markets.
Bear markets are the opposite of bull markets, characterized by falling prices and pessimistic investor sentiment. The main advantage of bear markets is that they offer the opportunity to buy assets at bargain prices. However, there is also a downside to bear markets: they can be followed by sharp rallies or even bull markets.
Consolidation periods are characterized by sideways price action and mixed investor sentiment. The main advantage of consolidation periods is that they offer a chance for investors to take a breather and reassess their portfolios. However, there is also a downside to consolidation periods: they can be followed by either bull or bear markets.
Examples of How the Theory Has Worked in Practice
There are three different stages of market trends according to the Dow theory: primary, secondary, and tertiary.
The primary stage of a market trend is when the price of a security is trending in one direction. This is the stage when most investors are buying or selling the security. The secondary stage is when the price of the security consolidates and starts to move in the opposite direction. This is typically a period of indecision among investors. The tertiary stage is when the price of the security starts to trend in the original direction again.
The Dow theory has been used successfully by investors to predict market trends. For example, in 2009, investor Warren Buffett used the Dow theory to predict that the stock market would recover from the financial crisis. He bought shares of several companies that he believed were undervalued during the secondary stage of the market trend. As a result, he made billions of dollars when the market recovered and share prices increased.
Alternatives to the Dow Theory
There are a number of different ways to approach market analysis and forecasting, and the Dow Theory is just one of many tools that investors can use. Some popular alternatives to the Dow Theory include technical analysis, fundamental analysis, and various quantitative approaches.
Technical analysis is a method of analyzing markets that focuses on price action and chart patterns. Technical analysts believe that prices move in patterns and that these patterns can be used to predict future market behavior. Many technical indicators and charting techniques can be used in conjunction with each other to generate buy and sell signals.
Fundamental analysis is another popular approach to market analysis. Fundamentalists believe that prices are driven by underlying economic, political, and social factors. They analyze these factors in order to forecast future market trends. Fundamental analysis can be used to identify long-term investment opportunities as well as shorter-term trading strategies.
There are also a number of quantitative approaches to market analysis and forecasting. These methods make use of mathematical models and statistical techniques to identify trends and make predictions about future market behavior. Many quants use computer-based systems to automate their trading decisions.
Conclusion
In conclusion, the Dow Theory is a helpful tool for understanding market trends. By recognizing the primary and secondary phases of the trend, investors can enter into trades with greater confidence and increase their chances of success. Additionally, by considering both long-term and short-term trading strategies in accordance with this theory, traders can capitalize on opportunities to optimize their profits while minimizing risk.