
A head and shoulders pattern is a bearish reversal chart pattern that forms after an uptrend. The pattern is made up of three peaks, with the middle peak being the highest and the two side peaks being lower. The pattern signals that the buyers are losing control and that the sellers are taking over.
You can also read: What Is Average True Range?
What is a head and shoulders pattern?
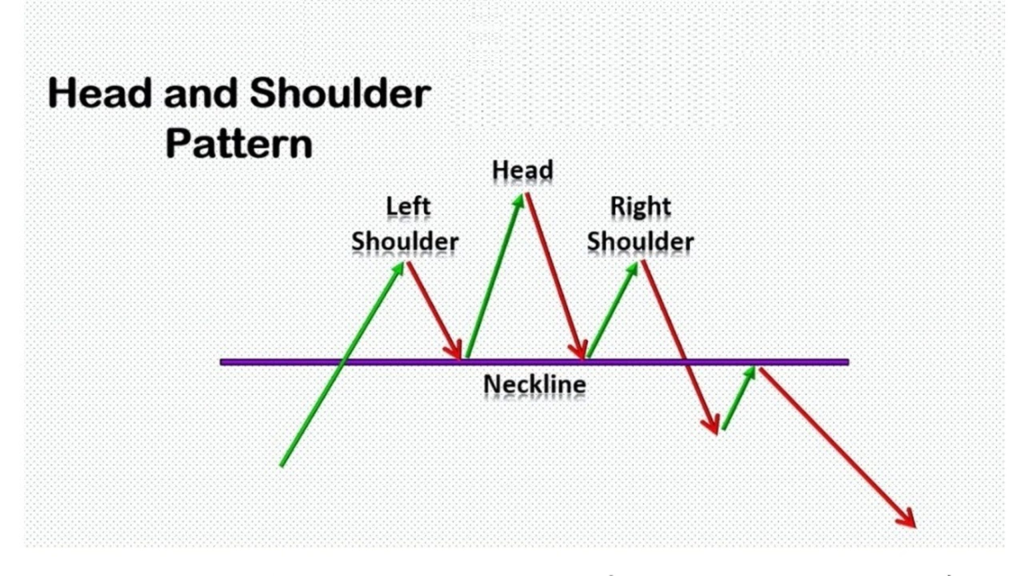
A head and shoulders pattern is a reversal chart pattern that is typically seen at the top of an uptrend. It is made up of three consecutive rallies, with each rally reaching a higher high followed by a sell off to a new low. The pattern is considered complete when the price breaks below the neckline, which is formed by connecting the lows of the left and right shoulders.

How to identify a head and shoulders pattern?
A head and shoulders pattern is a bearish reversal pattern that is formed when the price of an asset reaches a new high, pulls back, and then fails to reach the previous high. The left shoulder is formed when the price reaches a new high and then pulls back. The head is formed when the price again reaches a new high and then falls back. The right shoulder is formed when the price falls below the neckline.
What causes a head and shoulders pattern?
A head and shoulders pattern can be caused by a variety of factors, but most often it is the result of a trend reversal. This means that the market has been moving in one direction for some time, but is now starting to move in the opposite direction. There are many different factors that can cause this to happen, such as changes in economic conditions, political events, or even just shifts in investor sentiment.
The head and shoulders pattern is one of the most reliable reversal patterns out there, and so it’s important to be aware of what can cause it to form. By knowing the potential causes, you’ll be better equipped to spot the pattern early and take advantage of the opportunity.
How to trade a head and shoulders pattern?
When it comes to trading head and shoulders patterns, the key is to focus on the shoulders. The right shoulder should be lower than the left, and the head should be in between. You want to see a clear trendline forming from the left shoulder to the head, and then another one from the head to the right shoulder.
The ideal time to enter a trade is when the neckline is broken. This is typically marked by a candlestick with a long wick, known as a pin bar. Your stop loss should be placed just below the right shoulder, and your target profit can be taken at previous support levels.
Conclusion
A head and shoulders pattern is a technical chart formation that is created when the price of an asset forms two peaks followed by a trough. The first peak is typically considered the “head,” while the second is considered the “shoulder.” This pattern often signals that a reversal in price may occur, as investors begin to lose confidence in the asset. Head and shoulders patterns can be found in various timeframes, but are most commonly seen on daily or weekly charts.