Moving average is a technical indicator that market analysts and investors may use to determine the direction of a trend. The data points summarize financial security over a specific period of time and divide the total by the number of data points to reach an average. This average is called “moving” because it is constantly recalculated based on the latest price data.
Analysts use the moving average to measure support and resistance by assessing asset price movements. Moving Average is the average price of a futures, forex, digital currency or stock over a period of time. Therefore, Analysts, traders and investors utilize the data to determine the direction of the market price. This index is known as a lag indicator because it tracks the price performance of the underlying asset to generate a signal or indicate the direction of a particular trend.
You can also read: How to calculate crypto gains?
Moving Average is the average price of a futures contract or stock over a period of time. Traders can only add one moving average or have different time frames on a chart.
What is forecasting Moving Average (MA)?
Moving Average is a simple technical analysis tool. The moving average is usually calculated to identify the direction of a stock or to determine its support and resistance levels. This is an indicator of following the trend because it is based on past prices.
The longer the moving average period, the longer the delay. Therefore, the 200-day moving average will have a much higher degree of delay than the 20-day MA, as it includes the prices of the last 200 days. The 50-day and 200-day moving average figures for stocks are widely followed by investors and traders and are considered as an important trading signal.
Moving averages are a fully customizable indicator, meaning that an investor can freely choose any time period when calculating the average. The most common time periods used in the moving average are 15, 20, 30, 50, 100 and 200 days. The longer the time interval, the lower the average sensitivity.
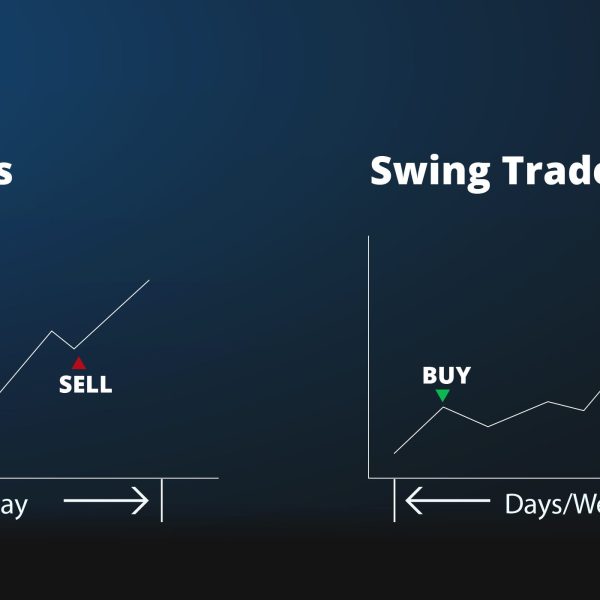
Investors may choose different time periods to calculate the moving average based on their trading goals. Shorter moving averages are usually used for short-term trades, while long-term moving averages are more suitable for long-term investors.
There is no set time frame for use when setting moving averages. The best way to find out which one works best for you is to try several different time periods until you find one that fits your strategy.
Predicting stock market trends is not an easy process. While it is impossible to predict the future movement of a particular stock, using technical analysis and research can help you better predict.
The moving average indicates that the securities are on an uptrend, while the decreasing moving average indicates that it is on a downward trend. Similarly, an uptrend is confirmed by an uptrend cross, which occurs when the short-term moving average crosses the long-term moving average. Conversely, a bearish move is confirmed by a bearish cross, which occurs when the short-term moving average crosses the long-term moving average.
While the moving average calculation is useful in itself, it can also be the basis for other indicators of technical analysis, such as the moving average convergence divergence (MACD).
MACD indicator is used by traders to monitor the relationship between two moving averages. In general, by subtracting the moving average of 26 days, it is calculated from the moving average of 12 days.
When the MACD is positive, the short-term average is higher than the long-term average. This is a sign of upward movement. When the short-term average is lower than the long-term average, this is a sign of reduced movement. Many traders are also wary of moving above or below the zero line. A move above zero is a signal to buy, while a cross below zero is a signal to sell.
Forecasting Moving Averages types
The following are the two basic forms of moving averages:
Simple Moving Average (SMA)
Simple Moving Average (SMA) is a simple technical index obtained by adding recent data points in a given set and dividing the total by the number of time periods. Traders use the SMA indicator to generate a signal about when to enter or leave the market. An SMA lags behind because it relies on past price data for a given period. It can be calculated for different types of prices, i.e. high, low, open and closed prices.
In financial markets, analysts and investors use the SMA indicator to determine the signals of buying and selling securities. SMA helps identify support and resistance prices to get signals about where to enter or exit a trade.
When creating an SMA, traders must first calculate this average by adding prices over a given period and dividing the total by the total number of periods. The information is then plotted on a graph.
Exponential Moving Average (EMA)
Another type of moving average is the exponential moving average (EMA), which gives more weight to the latest price points to be more responsive to recent data points. The exponential moving average is more responsive to recent price changes than the simple moving average, which applies equal weight to all price changes over a given period.
The following three steps are used when calculating the exponential moving average:
1. Calculate the simple moving average for the course
The EMA has to start somewhere and the simple moving average is used as the EMA of the previous period. It is obtained by summing the closing prices of securities for the desired period and dividing the total by the number of periods.
2. Calculate the weighting coefficient of the exponential moving average
This is the formula for calculating the coefficient:
Multiplayer = [2 / (selected time period + 1)]
3. The last step is to calculate the current exponential moving average
The last step calculates the current EMA by taking the period from the initial EMA to the last time period, using the price, coefficient and amount of the previous period EMA. Calculated using the following formula:
Current EMA = [Closing price – EMA (previous period)] x coefficient + EMA (previous period)
The weight given to recent price data for the longer EMA is shorter than the shorter period EMA. A coefficient of 18.18% applies to the recent price points of a 10-period EMA, while a coefficient of 9.52% applies to the recent price points of a 20-period EMA.
Weighted Moving Average (WMA)
Weighted moving average (WMA) is a technical indicator that traders use to establish business direction and decide to buy or sell. Assigns more weight to recent data points and less weight to past data points. This moving average calculated by multiplying every observation in the set data with a predetermined weighting factor.
Traders use weighted average tools to generate trading signals. For instance, when the price action moves towards or above the moving weighted average, the signal can be a sign to exit the trade. However, if the price action is close to or below the moving average, it could be a sign of the right time to enter the trade.
Using the weighted moving average to determine the direction of the trend is more accurate than the simple moving average, which assigns the same weights to all numbers in the dataset.
Hull moving average
The hull moving average indicator, which is one of the oscillation indicators, is one of the best tools in the field of oscillation. When you use this indicator, you will find that this tool works very well in fluctuations, and in the parts where you can get a good profit from the fluctuation of a share, you will find that it is much more useful than other tools.
In this way, when the stock enters a downtrend, when the moving average of the body is out of the downtrend and is parallel to the horizontal line and rises slightly, you can enter the stock and make good profit from the fluctuations of that stock. In the field of moving average of the body, you can use the same golden numbers, and the point that we must suggest to you is that you should consider your signals in relation to the short-term trend.
Smoothed moving average
The smoothed moving average, which is the method of obtaining this type of moving average, is the last price in the candlestick or stock symbol and calculates the previous stock information in the chart based on the latest prices. This indicator can detect fluctuations very well for you. In this method, the indicator gives new weight to the new information equal to the old information, but in its calculations also takes into account all its past history. This has caused this moving average to move very slowly compared to other moving averages and does not react to sudden price changes in a timely manner.
What Are Some Examples of Moving Averages?
Different types of moving averages have been created for use in investing. For instance, the Exponential Moving Average (EMA) is a moving average that gives more weight to recent trading days. This type of moving average may be useful for short-term traders who are less relevant to long-term historical data. A simple moving average, on the other hand, is calculated by averaging a series of prices while giving the same weight to each of the respective prices.
What Are Moving Averages Used for?
Moving averages are widely used in technical analysis, a branch of investment that seeks to understand and benefit from stock price patterns and indices. In general, technical analysts use moving averages to determine whether a change in movement is occurring for a security, such as if there is a sudden downward movement in the price of a security. Other times, they use the moving average to confirm their suspicion that a change may be taking place. For example, if a company’s stock price is above its 200-day moving average that might be considered an uptrend.
In conclusion
Forecasting moving average is one of the indicators used by even the most experienced technical analysts and its simplicity has made it more popular among analysts and traders. Once you have learned how to use the moving average types, you can now look at your stock charts and see their current trends. You can also look at the sell signals that this indicator has given in the past to get the success of the trades.