J. Welles Wilder created the Parabolic SAR, a technical indicator that shows which way an asset is moving. The stop and reverse system, often known as the indication or SAR, is another name for it. Its goal is to spot probable price reversals for traded assets. Additionally, it can be applied to create entry and exit points.
The Parabolic SAR is most effective in markets that are trending. Wilder advises traders to utilize different indicators to gauge the trend’s strength after first determining the trend’s direction using the parabolic SAR.
You can also read: What does NGMI mean?
The Parabolic SAR indicator is plotted visually as a series of dots on a chart. The parabolic SAR is considered as a bullish indicator if it appears below the current price. It is regarded as a bearish signal when it is above the price that is being traded. Stop losses and profit goals are established using the signals.
Is parabolic SAR a good indicator?
When trading in a steady market during a trend, the Parabolic SAR excels at capturing profits.
When the price fluctuates sideways, it could provide false signals, and the trader should prepare for modest losses or modest gains. Stop loss orders can also be placed using the indication. This can be done by adjusting the stop loss to the SAR indicator’s level.
A Parabolic SAR has the advantage of assisting in determining the direction of price movement. When there is a strong trend, the indicator performs well. Additionally, the indicator provides an exit signal when a price reversal is possible when there is a move against the trend. The markets with protracted rallies or losses and trends where this tool performs best.
What is parabolic SAR strategy?
A trend trading strategy is essentially what the parabolic definition is. It is used to pinpoint a certain trend and makes predictions about how long it will last and whether it will eventually reverse.
For instance, if the parabolic line is green, you should continue to hold your long position and follow the bullish trend. If the parabolic line was red, you would continue to hold your short position and follow the negative trend.
But you can consider closing your current long trade and starting a short position if a green parabolic line is broken by one or two red dots. On the other hand, you can consider closing your current short position and initiating a long one if a red parabolic line is broken by one or two green dots.
Along with the parabolic SAR, you may utilize other trend trading technical indicators to try and confirm the current trend or any prospective trend reversals. The moving average indicator, the relative strength index (RSI), and the average directional index are a few examples of trend trading technical indicators (ADX).
Which timeframe is best for parabolic SAR?
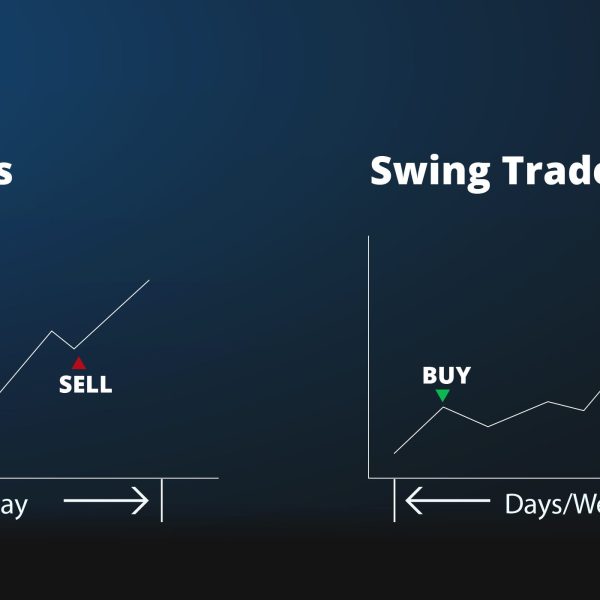
Similar to every other charting indication, the parabolic SAR performs effectively across all time frames. You need to take your trading strategy into account when deciding which time frame is most effective. Swing traders may employ daily, weekly, or monthly time frames whereas day traders may utilize one-minute, five-minute, or one-hour time frames.
Is parabolic SAR leading or lagging?
The parabolic SAR meaning is defined under the assumption that prices are never static and are always going up or down. It’s perfect for trending markets since they retain a diagonal trajectory while fluctuating between high and low points. Look for a price movement that begins in the top left-hand quadrant and goes diagonally down to the right, or vice versa, to spot a trending market in forex.
The parabolic SAR is a lagging indicator, so keep that in mind. In other words, it frequently lags behind the price and begins slowly before picking up speed along with the trend. Since all trailing indicators have a high propensity to generate false signals, trend-following trading techniques that can tolerate minor market stop-outs are preferred.
How do you read a parabolic SAR indicator?
When the dots move below the price bars, signaling an uptrend, you should buy, and when they move above the price bars, signaling a downturn, you should sell or short-sell.
As a result, there will always be trade signals since the trader will be in a position. These consistent trade signals might result in a string of losing trades if the price is only making minor movements in each direction. However, if the price is making large swings back and forth, this can be advantageous.
Therefore, it is preferable to examine the day’s price movement to ascertain if the trend is upward or downward. The direction of the overall trend can also be determined using another indicator, such as a moving average or trend lines. Only act on trade signals that are in line with the general trend if there is one. If the trend is downward, for instance, only act upon indications for short trades (when the dots reverse above the price bars) and only get out of the trade when the dots reverse below the price bars. In this approach, the indicator is made use of for what it is best at: spotting trends.
Hopefully, you won’t have to worry about the indicator’s flaw: non-profitable trade signals when there isn’t a trend, after you’ve created an overall pattern.
How can you prevent parabolic SAR false signal?
When the price movement begins to move sideways, the parabolic stock generates false indications. Lack of a trend causes the indicator to oscillate around the price bar, which results in false signals. Trading losses might occur when a trader exclusively uses the Parabolic SAR during sideways market circumstances.
Trading exclusively in the direction of the prevailing trend and staying away from trades when a trend is missing can help traders avoid such errors. Additionally, employing moving averages in addition to parabolic SAR can assist reduce such losses.
In conclusion
According to estimates and parabolic curves, the assets that are exhibiting a strong trend, which occurs 30% of the time, are the ideal use-case scenario for the SAR stocks. This could indicate that PSAR would be more susceptible to whipsaws when an asset is not trending or more frequently than 50% of the time. The most effective SAR to employ to determine a security’s price direction and to set stop-loss orders based on the data is the parabolic SAR, which traders should be aware of. Furthermore, if the price of the asset is moving laterally, the parabolic SAR indicator may produce a lot of misleading alerts. As a result, it works best when used in conjunction with other technical indicators to help filter out subpar trade signals.