Twitter is the best place to get current news, connect with your friends and family and also broadcast your opinions. Being a social media platform itself, Twitter might be useful for you, if you are a marketer. Well, Facebook and Instagram also do the job but what makes Twitter stand out? We will get its answer today, in this article.
Marketing on Twitter is not a piece of cake as tweets have a shorter life span and specific character limit. To use this application for marketing and showcasing your brand, knowing Twitter stats 2021 is necessary otherwise you won’t get the expected results. So, without doing any further delay let’s head on to know 12important Twitter stats.
Top Twitter stats of 2021
1. Number of Twitter users
Before starting to think about marketing on Twitter, knowing the number of Twitter users might boost your confidence. According to Twitter’s latest figures, there is a 21% increase in a year leading to more than 192 million active users on Twitter. Filtering the users, over 55 million of its users are from the US alone and this is approximately 28.6% of the total. If you are starting to compare this number with Facebook, then hold on, because Twitter has a better reach than Facebook.
2. Number of Tweets per day
If there are 192 million active users on Twitter then imaging the number of tweets per day. According to Internet Live Stats, there are almost 500 million tweets every day that adds up to 200 billion tweets per year.
In 2020, there were about 7000 tweets per minute about TV or movies and 2 billion tweets in the whole year about sports. Tweets about cooking also increased by 300%.
3. Twitter hashtags
The trend of hashtags started from Twitter which then got exported to Instagram and other social media platforms. In 2021, #COVID19 was the number one trending hashtag on Twitter used nearly 400 million times. The second one was #BlackLivesMatter followed by #Stayhome.
4. Twitter popularity in the US
According to the latest Twitter Usage Statistics in the third quarter of 2020, 52% of American Twitter users accessed the platform daily and almost 84% used it weekly. Finally, 96% of American users accessed this social media platform monthly.
5. Growth prediction of Twitter’s user base
According to the eMarketers report, Twitter would see a growth rate of 2.4 percent in 2021 followed by 2.0% in the year 2022. Previously, eMarketer predicted twitter to grow by the rate of 2.8% in 2020 but it showed a significant 8.4% increase in the number of users. So, now you know that the chances of your business getting discovered on Twitter are also increasing.
6. Twitter demographics- Age
Though we can see a significant percentage of the young generation on Instagram and Facebook, Twitter has its own audience to appeal. Approximately 28.9% of Twitter users are 25 to 34 years old. According to theVAB, 2018, 63% of Twitter users worldwide are of the age group 35 to 65 years. Men outnumber women in every age category, especially in the two mentioned above.
7. Twitter demographics- Gender
The worldwide ratio of the number of males to that of females on Twitter is 2 to 1 or 66% males and 34% females. However, in the US, this percentage difference appears to be decreasing with 56 percent males and 44 percent females.
Though more men are present on Twitter women are more interested in interacting with brands and shop from them.
The gender difference is more on Twitter as compared to Instagram and Facebook.
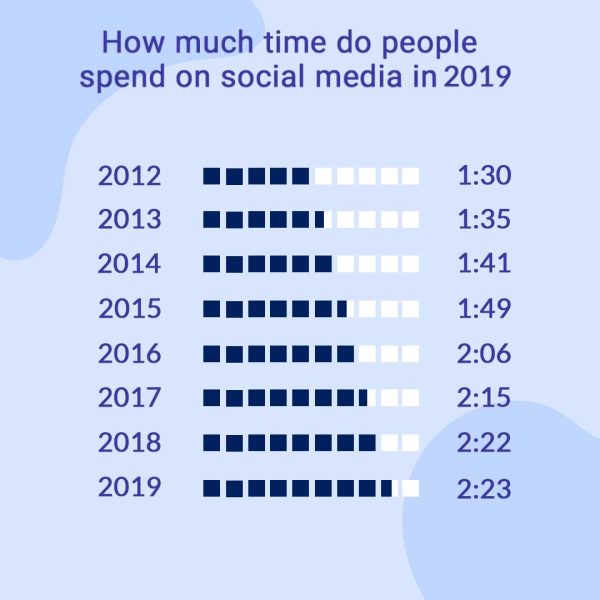
8. How much time users spend on Twitter
According to Statista, 2019, the average time spent on Twitter per session by a user is 3.39 minutes. This statistic should not surprise you as the lifespan of a tweet is also short (15 to 20 minutes). Twitter is mostly used as an outlet for news and communicating about it. In fact, nearly a quarter of verified accounts on it belong to journalists.
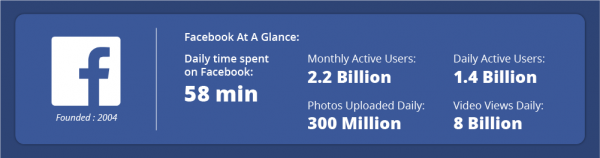
Tweets are small and contain ample information making them easier to grasp as compared to long-form captions. This is the reason behind such a short amount of time per session by the users. Facebook has an average of 4.96 minutes per session.
9. Increase in Twitter’s ad revenue
According to the eMarketer report in 2020, Twitter ad revenue went up by 15% in that year. Advertisers spent almost $808 million on advertisements on Twitter in the third quarter of 2020. The USA brings most of the advertisement income to Twitter, followed by Japan in the second position.
10. Twitter ad engagement
According to Twitter’s third-quarter 2020 report, the engagement of users on Twitter ads has significantly increased. Simultaneously, Twitter said that CPE (Cost Per Engagement) is down by 9%. Marketing on Twitter might be cheaper and more effective as compared to Facebook and Instagram and you can get extra benefit by creating more engaging ads. Many influencers tend to buy twitter followers to increase their engagement and generate more ad engagements.
11. Twitter influence on brand sales
According to the Digital Marketing Institute, 2019, 4 out of 10 Twitter users made the purchase of a product after seeing its ad on social media. This means that Twitter is having a great influence on consumers and is also highlighting the fact that it has become necessary for brands to be present on social media.
12. Twitter tops the list in Japan
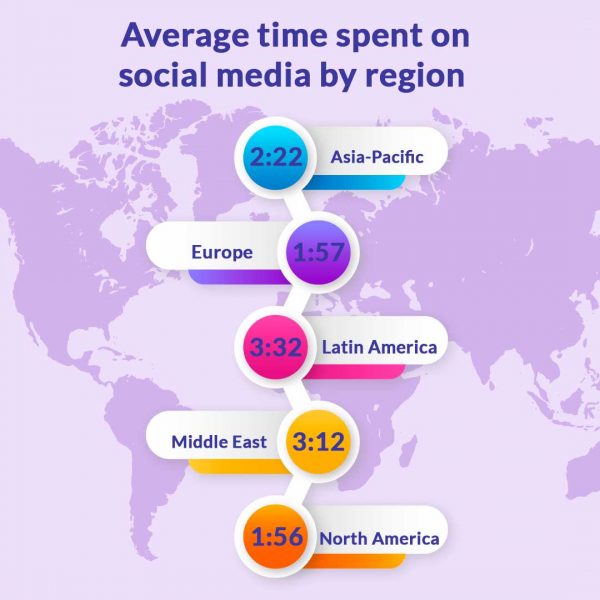
Though Facebook is the number one social media platform in the US, Twitter dominates in Japan. More than 64.1% of Japanese people use Twitter. In fact, more than 25% of Twitter users are from Asia-Pacific.
Conclusion
We hope these 12 stats will help and motivate you to sign up on Twitter and make your business a huge success over it. With more than 192 million daily active users, you have the chance to engage with a new audience every day and expand your business in a cost-effective manner. Most of the businesses are already advertising on Twitter to increase their engagement and leads and if you are not onboard yet, then you should be, ASAP.