

The bull flag pattern is one of the best ways to identify and predict the stock market and digital currencies. This article will thoroughly teach bull flag pattern recognition methods and examine their usages with an example. Have you ever heard of the bull flag pattern?
- What is a bull flag pattern?
- How to recognize a bull flag pattern
- Bull flag pattern trading strategy
- How reliable is the bull flag pattern?
- Bull flag and Bear flag differences
Bull flag pattern
The bull flag pattern is a type of stop sign that occurs before a solid purchase. The bull flag pattern is exactly like a drop chart that goes down with two parallel lines.
At the merger, the volume of trades gradually increases and tends to cross the breaking line. The exact shape of the price in the bull flag pattern is precisely like a flag, which is why it is called the bull flag.
Bull flag pattern recognition method
Identifying a bull flag pattern is a bit difficult because it consists of several different parameters and can not always be predicted with a specific pattern. To accurately identify it and trade based on it, you need to know the parameters that affect the formation of this pattern. All of these parameters include the following:
- Elementary uptrend
- Detects downward integration after an uptrend
- If the correction rate for this trend was more than 50%, we probably do not have a bull flag pattern. Ideally, corrections should be made below 38% of the primary trend.
- The entry point is from the bottom of the flag or the top of the break in the final range.
- It will help if you are looking for a price that cuts the pole point of the flag to a larger size.
Bull Flag Trading Strategy
If you can recognize the bull flag correctly, there are efficient trading strategies behind this diagnosis that can be used to make huge investments and profits.
As you can see in the chart above, we see a kind of bull flag pattern in the Australian dollar price. In general, the Australian dollar has been growing faster than other currencies at this point in time.
According to the chart, we first have a growing trend in the form of a flag pole. The price returned to a downward trend and again experienced an increase in the size of the flag pole.
The level of trust in the bull flag template
The level of trust in the bull flag pattern depends on many factors. When all the components of the bull flag are recognizable and seen in a graph, the bull flag can be one of the best models for cross-sectional investment. You can see the benefits and limitations of reviewing this template through the table below.
| ADVANTAGES | LIMITATIONS |
| Works in all financial markets | Can be complex for novice traders |
| Pattern helps determine entry and limit levels | |
| Good risk-reward ratio |
Bull Flag vs. Bear Flag

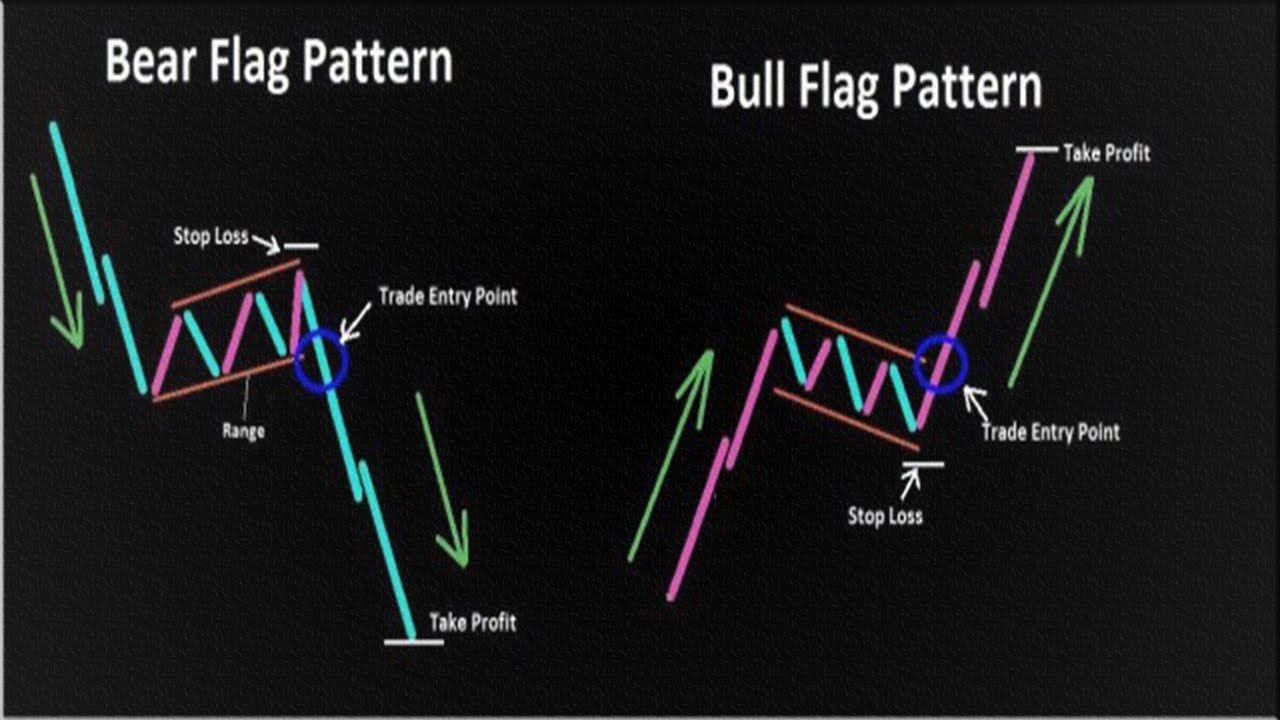
The opposite point of the bull flag is the bear flag pattern, which happens exactly the opposite.
- The bear flag pattern occurs when we first encounter a significant and severe drop.
- When the price breaks the lowest channel, the bear flag leaves the merger behind.
- Both the bull flag and bear flag patterns will increase or decrease precisely the size of the flag pole and remain in the same pattern.
Conclusion
Although we should not limit ourselves to just one pattern for trading the Forex market or digital currencies, the bull flag can be an excellent option to detect the start of a substantial investment. Pay attention to factors such as price growth rate and integration time to make a better diagnosis. However, nothing in the market can replace experience!