This powerful framework can help even beginner traders identify key patterns in price movements, providing valuable insights into future market behavior. In this comprehensive guide, we’ll break down everything you need to know about Elliott Wave Theory, from its history and basic principles to advanced techniques for chart interpretation. Whether you’re a seasoned investor or just getting started, this guide will give you the tools you need to succeed in today’s fast-paced financial markets.
You can also read: The Connection Between Short Squeezes and Quitting for Sellers
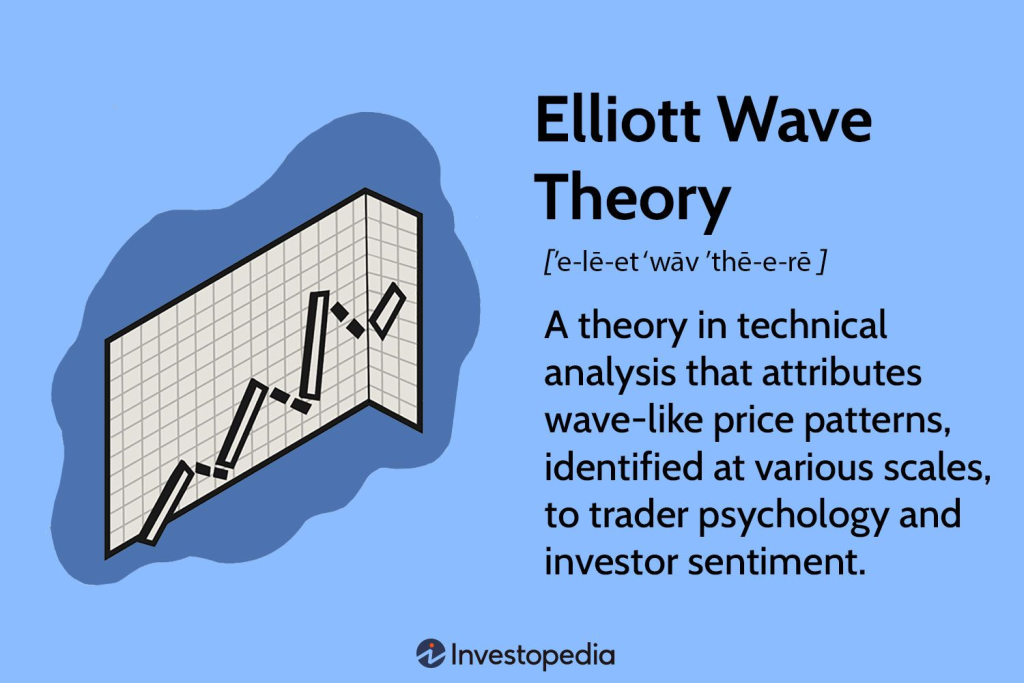
What is Elliott Wave Theory?
Elliott Wave Theory is a form of technical analysis that is used to predict future market movements. The theory is based on the belief that markets move in cycles, and that these cycles can be identified and predicted.
The theory was developed by Ralph Elliott, who observed that price action in the financial markets tended to repeat itself in patterns. He identified nine different wave patterns that he believed were indicative of future market direction.
While Elliott Wave Theory has its critics, it remains one of the most popular forms of technical analysis among traders and investors. Many believe that by correctly identifying market cycles, they can gain an edge in the markets.
Different Waves of the Elliott Wave
According to the theory, prices move in cycles, with each cycle consisting of a series of waves. The theory was developed by Ralph Nelson Elliott, who identified different types of waves and patterns that occur during these cycles.
The main types of waves that Elliott identified are impulse waves and corrective waves. Impulse waves move in the same direction as the overall trend, while corrective waves move against it. Each wave consists of sub-waves, which are themselves made up of smaller sub-waves. This fractal nature of market movements is one of the key concepts behind the Elliott Wave Theory.
The basic idea behind the theory is that market prices move in cycles, with each cycle consisting of a series of impulse and corrective waves. By correctly identifying these waves, analysts can attempt to predict future market movements. While there is no guarantee that this will be successful, many traders believe that the Elliott Wave Theory can be a helpful tool for making trading decisions.
Pros and Cons of Elliott Wave Theory
There are pros and cons to every investing strategy, and the Elliott Wave Theory is no different. Let’s take a look at some of the key advantages and disadvantages of this approach:
Pros:
- Many technical analysts believe that the Elliott Wave Theory is one of the most accurate ways to predict future market movements.
- It can be applied to any time frame, from long-term investors looking to make big moves in the stock market, to day traders trying to capitalize on short-term price changes.
- The theory takes into account both human psychology and mass market behavior, which many other technical analysis strategies do not.
Cons:
- The theory can be very complex, and difficult to understand for beginner investors.
- It often requires a lot of experience and knowledge in order to correctly identify all of the different waves.
- The theory has been known to produce false signals, leading investors astray.
How to Use Elliott Wave Theory in Trading?
Elliott Wave Theory is a technical analysis tool that can be used to identify market trends and make better trading decisions. The theory is based on the principle that markets move in cycles, and that these cycles can be identified and used to predict future market behavior.
The basic idea behind Elliott Wave Theory is that markets move in waves, with each wave representing a different stage in the overall cycle. There are three main types of waves:
- Impulse Waves: These waves move in the same direction as the overall trend and are typically the longest and strongest waves.
- Corrective Waves: These waves move against the overall trend and usually follow impulse waves. They are typically shorter in duration than impulse waves.
- Diagonal Waves: These occur when the market is changing direction from an up trend to a down trend, or vice versa. Diagonal waves are typically made up of smaller sub-waves.
To use Elliott Wave Theory in trading, you need to first identify the current market trend. Once you have done this, you can then look for wave patterns that will give you clues as to where the market is likely to go next. It is important to remember that no two wave patterns are ever exactly alike, so it is important to use your judgement when interpreting them.
If you are new to Elliott Wave Theory, it may be helpful to start by using simple software programs that can help you identify wave patterns. As you become
Examples of Elliott Wave Theory in Action
When it comes to technical analysis, there are many different theories and indicators that traders use to try and predict future market movements. One of the most popular theories is Elliott Wave Theory.
In this article, we will take a look at what Elliott Wave Theory is, how it works, and some examples of how it can be used in the markets.
Alternatives to Elliott Wave Theory
There are a number of different ways to approach technical analysis, and no one method is necessarily better than another. Some investors prefer to use Elliott Wave Theory as their primary tool, while others find that it doesn’t offer the predictive power they’re looking for. If you’re not sure whether Elliott Wave Theory is right for you, consider some of the following alternatives:
1. Fundamental Analysis
This approach focuses on economic indicators like GDP, inflation, and unemployment rate to identify long-term trends in the markets.
2. Technical Analysis
Technical analysis looks at price patterns and charts to identify trading opportunities. Unlike Elliott Wave Theory, technical analysis doesn’t attempt to predict future market movements.
3. Sentiment Analysis
This approach gauges investor sentiment by tracking measures like put/call ratios and short interest levels. Sentiment analysis can be used to identify both bullish and bearish market environments.
4. Behavioral Finance
Behavioral finance studies how human emotions affect financial decision-making. This approach can help investors avoid making common mistakes, such as chasing after losing stocks or selling winners too early.
Conclusion
Elliott Wave Theory is a powerful tool for technical analysis that can help traders gain insights into the direction of market trends. With its ability to identify potential reversals and continuation patterns, it provides an additional layer of information that can be used to fine-tune trading decisions. As with any other form of analysis, understanding Elliott Wave Theory takes time and practice but with patience and dedication, it has the potential to provide great rewards.