How To Recover Metamask Wallet?

Recovering your Metamask wallet may seem daunting, but it doesn’t have to be. By following these simple steps, you can regain access to your funds and continue using your Metamask account.

Are you having trouble accessing your Metamask account? Maybe you lost your seed phrase, or your computer crashed, or you simply forgot your password. Don’t worry, you’re not alone. Metamask is a popular digital wallet that allows users to store, send, and receive Ethereum and other ERC-20 tokens. While Metamask provides a convenient and secure way to manage digital assets, there may be situations where users need to recover their wallet due to loss of a seed phrase, a computer crash, or forgotten password.

Fortunately, recovering a Metamask wallet is a straightforward process that can be done in a few simple steps. In this article, we’ll provide a step-by-step guide on how to recover your Metamask wallet, as well as tips and best practices for keeping your digital assets safe and secure. Whether you’re a new or experienced Metamask user, this guide will help you regain access to your wallet and ensure that your digital assets are protected.

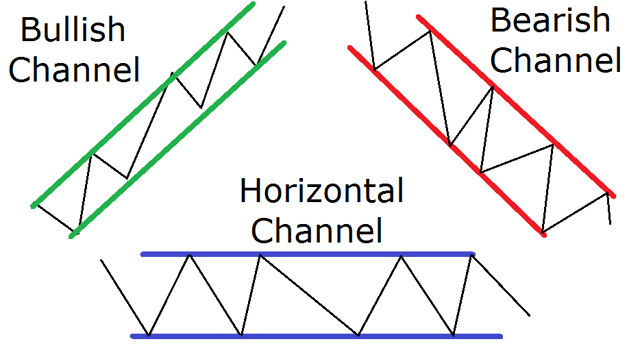
You can also read: Understanding the Price Channel (A Comprehensive Guide)

What is Metamask?

Metamask is a browser extension and mobile app that allows users to interact with decentralized applications (dApps) on the Ethereum blockchain. It serves as a digital wallet where users can store, send, and receive Ethereum and other ERC-20 tokens. Metamask provides a simple and secure way for users to access Ethereum-based dApps without having to run a full Ethereum node. It also allows users to manage multiple Ethereum accounts, connect to different Ethereum networks, and sign transactions securely using their private keys. Metamask is a popular choice for Ethereum users who want a user-friendly and convenient way to interact with the Ethereum ecosystem.

Metamask was founded in 2016 by Aaron Davis and is based in the United States. The company’s mission is to make it easy for anyone to interact with the Ethereum blockchain and participate in the decentralized economy. Metamask is a non-custodial wallet, which means that users have full control over their private keys and digital assets. This gives users the ability to manage and secure their own funds, without having to rely on a third party.

Metamask is available as a browser extension for Chrome, Firefox, Brave, and Edge, as well as a mobile app for iOS and Android. It has a user-friendly interface that makes it easy for users to interact with dApps and manage their digital assets. Metamask also provides users with a seed phrase, which is a 12-word phrase that can be used to recover their account in case they lose access to their device or forget their password.

In addition to its wallet features, Metamask also provides a development environment for Ethereum developers called “Metamask Snaps.” This allows developers to build and test their dApps directly within the Metamask extension, streamlining the development process and making it easier to create new decentralized applications.

Overall, Metamask has become a popular tool for Ethereum users due to its user-friendly interface, convenient access to dApps, and strong security features that give users control over their digital assets.

How to recover Metamask account?

There are several reasons why you may need to recover your Metamask wallet. Here are a few common scenarios:

  • You lost your seed phrase: Your seed phrase is a 12-word phrase that serves as your backup in case you ever need to recover your wallet. If you lose your seed phrase, you won’t be able to recover your wallet without it.
  • Your computer crashed: If your computer crashed and you didn’t have a backup of your seed phrase, you may need to recover your wallet.
  • You forgot your password: If you forgot your Metamask password, you won’t be able to access your wallet without resetting it.

Now that you know why you may need to recover your Metamask wallet, let’s get into the steps to do so:

Step 1: Open Metamask

Open your Metamask extension or mobile app and click on the three dots in the top right corner. Then click on “Settings” and select “Security & Privacy.”

Step 2: Click on “Reveal Seed Phrase”

Scroll down until you see the “Reveal Seed Phrase” button. Click on it and enter your Metamask password.

Step 3: Write down your seed phrase

Once you’ve entered your password, your seed phrase will be revealed. Write down the 12-word phrase on a piece of paper and store it somewhere safe and secure. Do not share this phrase with anyone, as it can be used to access your wallet.

Step 4: Import your wallet

If you already have a seed phrase but need to import it into a new device or browser, click on “Import Wallet” and enter your seed phrase.

Step 5: Reset your password

If you forgot your Metamask password, click on “Reset Password” and follow the prompts to create a new password.

Forgot MetaMask Password

Forgetting your Metamask password can be a frustrating experience, but it’s not the end of the world. If you find yourself in this situation, the good news is that you can easily reset your password and regain access to your wallet. Simply follow the steps outlined in the Metamask account recovery process, which involves clicking on “Reset Password” and following the prompts to create a new password.

It’s important to keep in mind that resetting your password will not affect your seed phrase or private key, so you can rest assured that your funds will remain safe and secure. However, it’s always a good idea to keep a backup of your seed phrase in a safe and secure location in case you ever need to recover your wallet in the future.

Lost Hardware Device

Losing your hardware device that stores your Metamask account information can be a stressful experience, but it doesn’t necessarily mean you’ve lost access to your account. Here are some steps you can take to recover your account if you’ve lost your hardware device:

  1. Use your seed phrase: If you have your seed phrase written down and stored in a safe and secure location, you can use it to restore your account on a new device. Open the Metamask extension or app on the new device, click on “Create New Wallet,” and select “Import Wallet.” Enter your seed phrase when prompted, and your account will be restored.
  2. Contact hardware wallet support: If you were using a hardware wallet to store your Metamask account and lost the device, contact the manufacturer’s support team for assistance. They may be able to help you recover your account or provide guidance on next steps.
  3. Enable two-factor authentication: To prevent future account loss or theft, consider enabling two-factor authentication (2FA) on your Metamask account. This adds an extra layer of security by requiring a second authentication factor, such as a code sent to your phone or generated by an app, in addition to your password. This makes it more difficult for unauthorized users to access your account, even if they have your password or seed phrase.

In any case, it’s important to take immediate action if you’ve lost your hardware device that stores your Metamask account information. By following these steps and best practices, you can recover your account and prevent future loss or theft of your digital assets. Remember to always keep your seed phrase and private key safe and secure, and never share them with anyone. By taking these precautions and staying vigilant, you can ensure that your Metamask account is secure and accessible when you need it.

In Conclusion

Recovering your Metamask wallet may seem daunting, but it doesn’t have to be. By following these simple steps, you can regain access to your funds and continue using your Metamask account. Remember to always keep your seed phrase safe and secure, and never share it with anyone. With these best practices in mind, you can rest assured that your digital assets are protected and accessible when you need them. Happy HODLing!

FAQs

  1. Can I recover my Metamask account without my seed phrase?

Unfortunately, if you’ve lost your seed phrase, you won’t be able to recover your Metamask account. The seed phrase serves as your backup in case you ever need to restore your wallet, so it’s important to keep it safe and secure. If you’ve lost your seed phrase, you may need to create a new account and transfer your funds to the new account

  1. What happens if I reset my Metamask password?

Resetting your Metamask password will not affect your seed phrase or private key, so you can rest assured that your funds will remain safe and secure. However, it’s important to keep a backup of your seed phrase in a safe and secure location in case you ever need to recover your wallet in the future.

  1. Can I recover my Metamask account if I lost my hardware device?

If you’ve lost your hardware device that stores your Metamask account information, you may still be able to recover your account. If you have your seed phrase written down and stored in a safe and secure location, you can use it to restore your account on a new device. Additionally, you can contact the manufacturer’s support team for assistance in recovering your account or obtaining a replacement device.

Understanding the Price Channel (A Comprehensive Guide)

The price channel is a useful tool for identifying trends and potential buying and selling opportunities in the market. To see and read more, follow our blogs.

The price channel is a technical analysis tool used by traders to identify trends and potential buy or sell signals. It is a useful tool for identifying points of support and resistance in a market and can be used to help traders make informed decisions about when to buy or sell a particular asset. In this guide, we will explore what the price channel is, the different types of price channels, how to read a price channel chart, the pros, and cons of using the price channel, and provide examples of trading strategies using the price channel.

You can also read: The Silent Danger of Replay Attacks(What You Need to Know?)

What is the Price Channel?

The price channel is a technical analysis tool that is used to identify trends in the market. It is created by drawing two parallel lines on a price chart, with one line representing the upper limit of the price movement and the other line representing the lower limit of the price movement. These lines are drawn based on the highest and lowest prices reached by the asset over a certain period of time.

The upper line of the channel is referred to as the resistance line, while the lower line is referred to as the support line. These lines are used to identify potential buying and selling opportunities, as they can help traders identify when the price of an asset is likely to break out of the channel and move in a new direction.

Types of Price Channels

There are three main types of price channels: the ascending channel, the descending channel, and the horizontal channel.

1. Ascending Channel

An ascending channel is formed when the price of an asset is consistently making higher highs and higher lows. In other words, the support line is sloping upwards, while the resistance line is also sloping upwards. This indicates that the asset is in an uptrend, and traders may look for buying opportunities when the price touches the support line.

2. Descending Channel

A descending channel is formed when the price of an asset is consistently making lower highs and lower lows. In other words, the resistance line is sloping downwards, while the support line is also sloping downwards. This indicates that the asset is in a downtrend, and traders may look for selling opportunities when the price touches the resistance line.

3. Horizontal Channel

A horizontal channel is formed when the price of an asset is moving sideways, with no clear trend in either direction. In this case, the support and resistance lines are horizontal and may be used to identify potential buying and selling opportunities when the price reaches either line.

How to Read a Price Channel Chart?

To read a price channel chart, you should first identify the two parallel lines that make up the channel. The resistance line represents the upper limit of the price movement, while the support line represents the lower limit of the price movement. These lines can be used to identify potential buying and selling opportunities, as well as to identify points of support and resistance in the market.

Traders may also use other technical indicators, such as moving averages, to confirm signals provided by the price channel. For example, if the price of an asset is touching the support line of an ascending channel and the 50-day moving average is also trending upwards, this may provide a stronger signal that the asset is in an uptrend and may be a good buying opportunity.

Pros and Cons of the Price Channel

While the price channel can be a useful tool for identifying trends and potential buying and selling opportunities in the market, traders should be aware of its limitations and use it in conjunction with other technical and fundamental analysis tools to make well-informed trading decisions.

Pros:

  1. Identifies Trends: A price channel is a useful tool for identifying trends in the market, which can help traders make informed decisions about when to buy or sell an asset.
  2. Provides Support and Resistance Levels: The support and resistance lines of the price channel can be used to identify potential points of support and resistance in the market, which can help traders make better decisions about when to enter or exit a trade.
  3. Easy to Use: The price channel is a simple tool that is easy to use and can be applied to a wide range of markets and assets.
  4. Provides Clear Entry and Exit Signals: The price channel can provide clear entry and exit signals for traders, making it easier to determine when to enter or exit a trade.
  5. Helps Manage Risk: By identifying support and resistance levels, the price channel can help traders manage risk by setting stop-loss orders at key levels.

Cons:

  1. False Signals: Like all technical analysis tools, the price channel is not infallible and can provide false signals, which can lead to losses for traders.
  2. Lagging Indicator: The price channel is a lagging indicator, which means that it may not provide signals until after a trend has already begun. This can result in missed opportunities or entering a trade too late.
  3. Limited Information: The price channel only provides information about the price movement of an asset, and does not take into account other factors that may influence the market, such as news events or economic data. This can make it difficult to make well-informed trading decisions based solely on the price channel.
  4. Can be Subjective: The process of drawing the support and resistance lines for a price channel can be subjective, which means that different traders may draw the lines differently and come up with different signals.
  5. May Not Work in All Markets: The price channel may not work as well in all markets or for all assets, as some markets or assets may not exhibit clear trends or may be too volatile for the price channel to be a reliable indicator.

Examples of Trading Strategies using the Price Channel

  1. Breakout Trading: Breakout trading is a popular strategy that involves buying an asset when it breaks out of a price channel. For example, if the price of an asset has been moving within a horizontal channel and then breaks out above the resistance line, this may be a signal to buy the asset.
  2. Trend-Following: Trend-following is a strategy that involves buying an asset when it is in an uptrend or selling an asset when it is in a downtrend. Traders may use the support and resistance lines of the price channel to identify trend direction and potential buying or selling opportunities.
  3. Mean Reversion: Mean reversion is a strategy that involves buying an asset when it is oversold and selling it when it is overbought. Traders may use the support and resistance lines of the price channel to identify when an asset is trading at an extreme level and may be due for a reversal.

What are some examples of markets or assets where the price channel may not work well?

While the price channel can be a useful tool for many markets and assets, there are some cases where it may not be as effective. Here are some examples:

  1. Highly volatile markets: The price channel may not work well in markets that are highly volatile, such as cryptocurrencies or penny stocks. These markets can experience rapid price movements that can make it difficult to draw accurate support and resistance lines.
  2. Illiquid markets: The price channel may not work well in illiquid markets, such as some small-cap stocks or thinly traded currency pairs. In these markets, there may be limited price data available, making it difficult to draw accurate support and resistance lines.
  3. News-driven markets: The price channel may not work well in markets that are heavily influenced by news events or economic data releases. In these markets, sudden news events can cause rapid price movements that can break through support or resistance levels, rendering the price channel less effective.
  4. Range-bound markets: The price channel is designed to work best in trending markets where the price is moving in a clear direction. In range-bound markets, where the price is moving sideways, the price channel may not be as effective as other technical analysis tools, such as oscillators or Bollinger Bands.
  5. Assets with low trading volume: The price channel may not work well for assets with low trading volumes, such as some small-cap stocks or exotic currency pairs. In these markets, there may be limited price data available, making it difficult to draw accurate support and resistance lines.

It’s important to note that the effectiveness of the price channel can vary depending on the specific market or asset being analyzed. Traders should always conduct a thorough analysis and use multiple technical analysis tools to confirm signals before making any trading decisions.

In conclusion

The price channel is a useful tool for identifying trends and potential buying and selling opportunities in the market. By drawing two parallel lines on a price chart, traders can identify potential points of support and resistance and make informed decisions about when to enter or exit a trade. While the price channel is not infallible and can provide false signals, it is a simple and easy-to-use tool that can be applied to a wide range of markets and assets. Traders may use the price channel in combination with other technical indicators to confirm signals and improve their trading results.

The Silent Danger of Replay Attacks(What You Need to Know?)

Replay attacks are a serious threat to data security. By intercepting and retransmitting data packets, an attacker can gain unauthorized access to systems, steal sensitive information, and cause significant financial losses.

As technology continues to advance, the need for security measures to protect sensitive information has become more critical than ever before. One of the most significant threats to data security is a replay attack. A replay attack is a type of cyberattack that can be costly to businesses, governments, and individuals.

In this article, we will discuss what a replay attack is, how it works, the potential consequences of a successful replay attack, and the steps you can take to prevent them.

You can also read about The Essential Guide to the EMA: Understanding Moving Averages in Trading Strategies

Introduction to Replay Attacks

A replay attack is a type of cyberattack that involves the interception and retransmission of data between two parties. The attacker intercepts data packets and then retransmits them to the original recipient. The attacker does not modify the data in any way; they merely replay it.

Replay attacks are often used to gain unauthorized access to a system or to obtain sensitive information, such as passwords or financial data.

How do Replay Attacks Work?

Replay attacks work by exploiting the lack of authentication and integrity checks in a communication protocol. When data is transmitted between two parties, it is typically encrypted to ensure its confidentiality. However, encryption alone is not enough to protect against replay attacks.

In a typical replay attack, an attacker intercepts the encrypted data packets as they are transmitted between two parties. The attacker then stores these packets and retransmits them to the original recipient at a later time. The recipient is unaware that the data packets have been replayed, and they assume that they are receiving fresh data.

Replay attacks can be prevented by using various security measures, such as timestamping and nonce values.

Types of Replay Attacks

Replay attacks can occur in various contexts, including financial transactions, network communications, and authentication protocols. Here are a few examples of replay attacks in action:

1. Authentication Protocol Replay Attack

In an authentication protocol replay attack, an attacker intercepts the authentication request sent from a user to a server. The attacker then replays the authentication request multiple times, attempting to gain access to the user’s account. If successful, the attacker can access the user’s sensitive information or perform unauthorized actions on their behalf.

2. Financial Transaction Replay Attack

In a financial transaction replay attack, an attacker intercepts a legitimate transaction request between a customer and a merchant. The attacker then replays the transaction request multiple times, causing the customer to be charged multiple times for the same transaction. This can result in significant financial losses for the customer.

3. Network Communication Replay Attack

In a network communication replay attack, an attacker intercepts data packets transmitted between two parties. The attacker then replays these packets at a later time, causing the recipient to receive the same data multiple times. This can cause significant disruptions to the communication network and may result in data loss or corruption.

Consequences of a Successful Replay Attack

The consequences of a successful replay attack can be severe, depending on the context in which the attack occurs. Here are a few potential consequences of a successful replay attack:

1. Financial Losses

In a financial transaction replay attack, the victim can suffer significant financial losses. They may be charged multiple times for the same transaction or have their account drained of funds.

2. Data Loss or Corruption

In a network communication replay attack, the victim may experience data loss or corruption. This can result in the loss of critical data or the corruption of sensitive information.

3. Unauthorized Access

In an authentication protocol replay attack, the attacker may gain unauthorized access to the victim’s account. This can result in the theft of sensitive information or the unauthorized performance of actions on the victim’s behalf.

What to Do if You Are a Victim of a Replay Attack?

There are a few things you may take to lessen the harm if you find yourself the target of a repeat attack. Change any potentially compromised passwords first. Second, get in touch with your financial institution(s) and let them know there’s a chance your account may have been compromised. Keep a watchful eye on any odd behaviour on your credit record.

Replay assaults can be devastating, but you can limit the harm by acting swiftly and decisively. If you think you might be the victim of a repeat attack, be on the lookout and ready to take action.

Ways to Prevent or Limit Replay Attacks

Preventing replay attacks involves implementing various security measures to ensure the integrity and authenticity of transmitted data. Here are a few steps you can take to prevent replay attacks:

1. Timestamping

Timestamping involves adding a unique timestamp to each data packet transmitted between two parties. The timestamp ensures that each packet is unique and cannot be replayed. Timestamping is an effective way to prevent replay attacks in communication protocols.

2. Nonce Values

Nonce values are random numbers generated by a system to ensure that each data packet is unique. Nonce values are used in conjunction with timestamping to prevent replay attacks. Nonce values are often used in authentication protocols to ensure the integrity of transmitted data.

3. Encryption

Encryption is another effective way to prevent replay attacks. By encrypting data packets, an attacker cannot intercept and replay the data. Encryption ensures the confidentiality and integrity of transmitted data.

4. Message Authentication Codes (MACs)

Message authentication codes (MACs) are cryptographic algorithms used to ensure the integrity and authenticity of transmitted data. A MAC is generated by combining the data with a secret key. The MAC ensures that the data has not been modified in transit and that it originated from a trusted source.

 More about Replay attacks

In addition to the information provided in the previous sections, there are a few more things to know about replay attacks.

Firstly, it’s important to note that replay attacks can be both passive and active. A passive replay attack involves simply intercepting and replaying data packets, while an active replay attack involves modifying the data packets before replaying them. Active replay attacks can be even more dangerous than passive attacks because they can allow an attacker to modify the data being transmitted, potentially causing even more damage.

Another key factor to consider is the role that authentication protocols play in preventing replay attacks. Authentication protocols are used to ensure that data is being transmitted between trusted parties. However, if an attacker is able to intercept and replay authentication requests, they may be able to gain unauthorized access to a system or account. Therefore, it’s crucial to use strong authentication protocols that are resistant to replay attacks.

It’s important to understand that replay attacks are not the only threat to data security. There are many other types of cyberattacks, including phishing attacks, malware attacks, and denial-of-service attacks, among others. It’s important to have a comprehensive security strategy in place that addresses all potential threats to data security.

Also, replay attacks are a significant threat to data security that can result in financial losses, data loss or corruption, and unauthorized access to systems or accounts. Preventing replay attacks involves implementing various security measures, including timestamping, nonce values, encryption, and MACs. By understanding the threat of replay attacks and taking steps to prevent them, individuals and organizations can ensure the integrity and confidentiality of their data.

What to Do if You Are a Victim of a Replay Attack?

Here’s some additional information on what to do if you are a victim of a replay attack:

If you suspect that you are a victim of a replay attack, the first thing you should do is contact the relevant authorities, such as your bank or the IT department of your organization. They can help you determine the extent of the attack and take appropriate action to limit the damage.

In addition, you should change all of your passwords and other authentication credentials as soon as possible. This will prevent the attacker from using the same method to gain access to your accounts or systems in the future.

You should also ensure that all of your software and security systems are up to date, as replay attacks can often take advantage of vulnerabilities in outdated software.

 If you have suffered financial losses as a result of a replay attack, you should contact your bank or credit card company immediately to report the issue and request a refund. Many banks and credit card companies have fraud protection programs in place that can help you recover your losses.

It’s crucial to learn from the experience and take steps to prevent future attacks. This may involve implementing additional security measures, such as two-factor authentication or more robust encryption protocols, or training employees on how to identify and prevent replay attacks.

All in all, if you are a victim of a replay attack, it’s important to take immediate action to limit the damage and prevent future attacks. This may involve contacting the authorities, changing your passwords, updating your software and security systems, and seeking refunds for any financial losses. By taking these steps and learning from the experience, you can protect yourself and your organization from the threat of replay attacks in the future.

In Conclusion

Replay attacks are a serious threat to data security. By intercepting and retransmitting data packets, an attacker can gain unauthorized access to systems, steal sensitive information, and cause significant financial losses. Preventing replay attacks involves implementing various security measures, such as timestamping, nonce values, encryption, and MACs.

As technology continues to advance, the need for robust security measures to protect sensitive information has become more critical. By understanding the threat of replay attacks and taking steps to prevent them, individuals and organizations can ensure the integrity and confidentiality of their data.

The Essential Guide to the EMA: Understanding Moving Averages in Trading Strategies

As we said, the Exponential Moving Average (EMA) is a popular technical indicator that is used by traders to identify trends, generate buy and sell signals, and react quickly to price changes.

Moving averages are one of the most widely used technical indicators in the world of trading. They are used to identify trends, determine support and resistance levels, and generate buy and sell signals. The Exponential Moving Average (EMA) is a popular type of moving average that has gained a lot of popularity among traders due to its ability to react quickly to price changes. In this guide, we will take a closer look at the essential aspects of the EMA, including how it works, types of moving averages, the benefits of using the EMA in trading strategies, and the disadvantages of using the EMA.

You can also read: The Power of Ascending Triangle Patterns in Financial Markets

What is the EMA?

The Exponential Moving Average (EMA) is a type of moving average that is similar to the Simple Moving Average (SMA), but it gives more weight to recent price data. This means that the EMA will react more quickly to price changes compared to the SMA. The EMA is calculated by taking the average of a series of prices over a specified period, with more weight given to the most recent prices.

The EMA is a popular technical indicator that is used by traders to identify trends in the market, as well as to generate buy and sell signals. It is commonly used in conjunction with other technical indicators, such as the Relative Strength Index (RSI), Moving Average Convergence Divergence (MACD), and Bollinger Bands.

How does the EMA work?

The EMA is calculated using a formula that gives more weight to the most recent prices. The formula for calculating the EMA is as follows:

EMA = (P – EMA(previous)) x multiplier + EMA(previous)

Where:

P = Current price

EMA (previous) = EMA value from the previous period

Multiplier = (2 / (n + 1)), where n = number of periods

The multiplier in the formula determines the weight given to the most recent prices. The smaller the value of n, the more weight given to the most recent prices. For example, if n = 10, the multiplier would be 0.1818, which means that the most recent price would be given a weight of 18.18% in the calculation of the EMA.

As new prices are added to the calculation, the EMA will adjust to reflect the new data. This means that the EMA will react more quickly to price changes compared to the SMA, which gives equal weight to all prices in the calculation.

Types of Moving Averages

In addition to the EMA and SMA, there are several other types of moving averages that are used by traders. These include:

1. Weighted Moving Average (WMA)

The Weighted Moving Average (WMA) is similar to the EMA, but it gives more weight to the most recent prices. The difference between the EMA and WMA is that the WMA uses a different weighting scheme that gives more weight to the most recent prices.

2. Hull Moving Average (HMA)

The Hull Moving Average (HMA) is a type of moving average that is designed to be more responsive to price changes compared to the SMA and EMA. The HMA is calculated using a weighted moving average of the difference between two Exponential Moving Averages.

3. Triangular Moving Average (TMA)

The Triangular Moving Average (TMA) is a type of moving average that is similar to the SMA, but it gives more weight to the middle prices in the calculation. The TMA is calculated by taking the average of a series of prices over a specified period, with more weight given to the middle prices.

Benefits of using the EMA in trading strategies

The EMA is a popular technical indicator that is used by traders for several reasons. Some of the benefits of using the EMA in trading strategies include:

1. Identifying trends

The EMA is commonly used to identify trends in the market. Traders will often use multiple EMAs with different periods to identify short-term, medium-term, and long-term trends. The direction of the EMA can be used to determine the direction of the trend, with an upward-sloping EMA indicating an uptrend, and a downward-sloping EMA indicating a downtrend.

2. Generating buy and sell signals

The EMA is also commonly used to generate buy and sell signals. When the price crosses above the EMA, it is considered a bullish signal, and when the price crosses below the EMA, it is considered a bearish signal. Traders will often use multiple EMAs with different periods to generate more reliable buy and sell signals.

3. Reacting quickly to price changes

The EMA is designed to react quickly to price changes, which makes it a useful indicator for traders who want to enter and exit trades quickly. The EMA is particularly useful in fast-moving markets, where the price can change rapidly.

4. Smoothing out price fluctuations

The EMA can also be used to smooth out price fluctuations and reduce noise in the price data. This can make it easier for traders to identify trends and generate buy and sell signals.

Disadvantages of using the EMA

While the EMA has several benefits, there are also some disadvantages to using this technical indicator. Some of the disadvantages of using the EMA in trading strategies include:

1. Whipsaw trades

One of the major drawbacks of using the EMA is that it can generate whipsaw trades in choppy markets. A whipsaw trade is a trade that is entered and exited quickly due to a false signal generated by the indicator. This can result in losses for the trader.

2. Lagging indicator

The EMA is a lagging indicator, which means that it is based on past price data. This can make it less effective in predicting future price movements. Traders will often use the EMA in combination with other technical indicators to generate more reliable signals.

3. Limited use in range-bound markets

The EMA is designed to identify trends in the market, which means that it may be less effective in range-bound markets where the price is moving sideways. In these markets, traders may need to use other technical indicators to generate buy and sell signals.

Examples and Strategies for Using the EMA

The Exponential Moving Average (EMA) is a popular technical indicator that can be used in a variety of trading strategies. In this section, we will explore some examples and strategies for using the EMA in your trading.

1. Trend following

One of the most common strategies for using the EMA is trend following. In this strategy, traders will use multiple EMAs with different periods to identify short-term, medium-term, and long-term trends. The direction of the EMA can be used to determine the direction of the trend, with an upward sloping EMA indicating an uptrend, and a downward sloping EMA indicating a downtrend.

Traders may also use the crossover of two EMAs of different periods to generate buy and sell signals. For example, when the shorter-term EMA crosses above the longer-term EMA, it is considered a bullish signal, and when the shorter-term EMA crosses below the longer-term EMA, it is considered a bearish signal.

2. Pullback trading

Another strategy for using the EMA is pullback trading. In this strategy, traders will wait for the price to pull back to the EMA before entering a trade. The EMA can be used as a support level in an uptrend or a resistance level in a downtrend.

When using this strategy, traders should wait for the price to touch or come close to the EMA before entering a trade. This can help to reduce the risk of false signals and whipsaw trades.

3. Breakout trading

The EMA can also be used in breakout trading strategies. In this strategy, traders will wait for the price to break above or below the EMA before entering a trade. The EMA can be used as a key level of support or resistance, indicating that a breakout may be imminent.

When using this strategy, traders should wait for the price to close above or below the EMA before entering a trade. This can help to reduce the risk of false signals and whipsaw trades.

4. Moving average crossover

Another strategy for using the EMA is the moving average crossover. In this strategy, traders will use two EMAs of different periods to generate buy and sell signals. When the shorter-term EMA crosses above the longer-term EMA, it is considered a bullish signal, and when the shorter-term EMA crosses below the longer-term EMA, it is considered a bearish signal.

Traders may also use multiple EMAs with different periods to generate more reliable signals. For example, a trader may use a 10-day EMA and a 50-day EMA to generate buy and sell signals.

5. EMA divergence

The EMA can also be used to identify divergence between the price and the indicator. When the price is making higher highs, but the EMA is making lower highs, it is considered a bearish divergence, indicating that the price may be due for a pullback. Conversely, when the price is making lower lows, but the EMA is making higher lows, it is considered a bullish divergence, indicating that the price may be due for a reversal.

Traders may use this strategy in conjunction with other technical indicators, such as the Relative Strength Index (RSI), to generate more reliable signals.

Alternatives to the EMA

While the Exponential Moving Average (EMA) is a popular technical indicator, there are several alternatives that traders may consider using in their trading strategies. Here are some of the most commonly used alternatives to the EMA:

1. Simple Moving Average (SMA)

The Simple Moving Average (SMA) is a basic type of moving average that gives equal weight to all prices in the calculation. While the SMA is less responsive to price changes compared to the EMA, it can still be effective in identifying trends and generating buy and sell signals.

2. Weighted Moving Average (WMA)

The Weighted Moving Average (WMA) is similar to the EMA, but it gives more weight to the most recent prices. The difference between the EMA and WMA is that the WMA uses a different weighting scheme that gives more weight to the most recent prices.

3. Hull Moving Average (HMA)

The Hull Moving Average (HMA) is a type of moving average that is designed to be more responsive to price changes compared to the SMA and EMA. The HMA is calculated using a weighted moving average of the difference between two Exponential Moving Averages.

4. Triangular Moving Average (TMA)

The Triangular Moving Average (TMA) is a type of moving average that is similar to the SMA, but it gives more weight to the middle prices in the calculation. The TMA is calculated by taking the average of a series of prices over a specified period, with more weight given to the middle prices.

5. Adaptive Moving Average (AMA)

The Adaptive Moving Average (AMA) is a type of moving average that adjusts its sensitivity to price changes based on market conditions. The AMA is designed to be more responsive to price changes in volatile markets and less sensitive to price changes in quiet markets.

6. KAMA (Kaufman Adaptive Moving Average)

The KAMA is another adaptive moving average that adjusts its sensitivity to price changes based on market conditions. The KAMA is designed to be more responsive to price changes in volatile markets and less sensitive to price changes in quiet markets.

7. Moving Average Ribbon

The Moving Average Ribbon is a series of moving averages of different periods that are plotted on the same chart. The Moving Average Ribbon is designed to identify trends and generate buy and sell signals based on the position of the price 

Traders may use the Simple Moving Average (SMA), Weighted Moving Average (WMA), Hull Moving Average (HMA), Triangular Moving Average (TMA), Adaptive Moving Average (AMA), KAMA (Kaufman Adaptive Moving Average), or Moving Average Ribbon to identify trends, generate buy and sell signals, and to react quickly to price changes. By understanding the strengths and weaknesses of these different types of moving averages, traders can choose the one that best suits their trading style and market conditions.

In conclusion

As we said, the Exponential Moving Average (EMA) is a popular technical indicator that is used by traders to identify trends, generate buy and sell signals, and react quickly to price changes. The EMA is a type of moving average that gives more weight to recent price data, which makes it more responsive to price changes compared to the Simple Moving Average (SMA). While the EMA has several benefits, including its ability to identify trends and generate buy and sell signals, there are also some disadvantages to using this technical indicator, including whipsaw trades and its limited use in range-bound markets. Traders will often use the EMA in combination with other technical indicators to generate more reliable signals and to reduce the risk of false signals.

The Power of Ascending Triangle Patterns in Financial Markets

The ascending triangle pattern is a powerful bullish pattern that can provide valuable insights into future price movements.

The financial markets are complex and unpredictable, and traders are always looking for new and innovative ways to outperform the market. One of the most popular strategies for trading in the financial markets is technical analysis. Technical analysis involves studying charts and identifying patterns that can provide insight into future price movements.

One such pattern is the ascending triangle pattern. The ascending triangle pattern is a bullish pattern that is formed when the price of an asset is consolidating in a narrowing range. This pattern indicates that there is a conflict between buyers and sellers, with buyers becoming increasingly aggressive and driving the price higher.

You can also read: Maximizing Your Portfolio with the Wheel Strategy

Introduction to Ascending Triangle Patterns

The ascending triangle pattern is a variation of the triangle pattern and is considered a bullish pattern because it indicates that buyers are gaining strength and are likely to push the price higher. It is an important pattern that traders use to identify potential entry and exit points for trades. By correctly identifying and analyzing the pattern, traders can potentially outperform the market and achieve significant profits.

Traders can use various technical indicators to confirm their analysis of the ascending triangle pattern. These indicators include the relative strength index (RSI), moving averages, and volume indicators. The RSI measures the strength of the trend, and if it is trending higher and is above its 50-day moving average, it is a bullish signal.

What is an Ascending Triangle Pattern?

An ascending triangle pattern is a bullish pattern that is formed when the price of an asset is consolidating in a narrowing range. This pattern is characterized by a horizontal resistance level that acts as a barrier preventing the price from moving higher. At the same time, a series of higher lows indicate that buyers are becoming more aggressive.

The ascending triangle pattern is a variation of the triangle pattern, which is a common pattern in technical analysis. The ascending triangle is considered a bullish pattern because it indicates that buyers are gaining strength and are likely to push the price higher.

Benefits of Using an Ascending Triangle Pattern

The ascending triangle pattern has several benefits for traders who use it in their analysis. Here are a few key benefits:

  1. Clear Entry and Exit Points: The ascending triangle pattern provides clear entry and exit points for traders. Traders can enter a long position once the price breaks above the resistance level, and they can exit the position if the price falls below the support level.
  2. Easy to Identify: The ascending triangle pattern is relatively easy to identify, even for novice traders. Traders can use charting software or technical indicators to identify the pattern and confirm their analysis.
  3. Strong Bullish Signal: The ascending triangle pattern is a strong bullish signal that indicates buyers are gaining strength and are likely to push the price higher. Traders can use this pattern to enter long positions in the asset and potentially outperform the market.
  4. Low Risk, High Reward: The ascending triangle pattern provides traders with a low-risk, high-reward opportunity. Traders can enter a long position with a stop-loss below the support level, limiting their risk while potentially enjoying significant profits if the price moves higher.

Strategies for Trading with an Ascending Triangle Pattern

There are several strategies that traders can use when trading with an ascending triangle pattern. Here are a few key strategies:

  1. Breakout Trading: Breakout trading is a popular strategy that traders use when trading with an ascending triangle pattern. Traders wait for the price to break out above the resistance level before entering a long position in the asset. The breakout should be accompanied by high trading volume to confirm the strength of the trend.
  2. Retest Trading: Retest trading is another strategy that traders can use when trading with an ascending triangle pattern. Traders wait for the price to break out above the resistance level and then wait for a retest of the level before entering a long position. The retest should be accompanied by lower trading volume to confirm that the level is now acting as support.
  3. Stop-Loss Placement: Stop-loss placement is a crucial strategy when trading with an ascending triangle pattern. Traders should place their stop-loss below the support level to limit their risk in case of a false breakout or a sudden price movement.

Characteristics of Ascending Triangle Pattern

The ascending triangle pattern is characterized by a series of higher lows and a horizontal resistance level. The resistance level acts as a barrier that prevents the price from moving higher, but as buyers become more aggressive, the resistance level is eventually broken, and the price moves higher.

The key characteristics of an ascending triangle are:

1. A horizontal resistance level that acts as a barrier to further price movement.

2. A series of higher lows that indicate buyers are becoming more aggressive.

3. Increasing trading volume as the pattern forms, indicating a growing interest in the asset.

Identifying Ascending Triangle Pattern

Identifying an ascending triangle pattern is relatively simple. Traders need to look for a series of higher lows and a horizontal resistance level. To confirm the pattern, traders should also look for increasing trading volume as the pattern forms.

Once the pattern is identified, traders can use technical indicators to confirm their analysis. One such indicator is the relative strength index (RSI), which measures the strength of the trend. If the RSI is trending higher and is above its 50-day moving average, it is a bullish signal.

Trading Ascending Triangle Pattern

The ascending triangle pattern is a bullish pattern that indicates that buyers are becoming increasingly aggressive. Traders can use this pattern to enter long positions in the asset, with a stop-loss below the support level.

To trade the ascending triangle pattern effectively, traders should wait for the breakout above the resistance level before entering a long position. The breakout should be accompanied by high trading volume to confirm the strength of the trend.

Traders should also be aware of false breakouts, where the price breaks above the resistance level but then quickly returns to the consolidation range. To avoid false breakouts, traders should wait for a close above the resistance level before entering a long position.

Alternatives to the Use of an Ascending Triangle Pattern

While the ascending triangle pattern is a powerful tool for traders, it is not the only pattern that traders can use in their analysis. Here are a few alternatives to the use of an ascending triangle pattern:

  1. Descending Triangle Pattern: The descending triangle pattern is a bearish pattern that is the opposite of the ascending triangle pattern. This pattern is characterized by a horizontal support level and a series of lower highs. Traders can use this pattern to enter short positions in the asset.
  2. Head and Shoulders Pattern: The head and shoulders pattern is a reversal pattern that is formed after an uptrend. This pattern is characterized by a peak (the head) and two smaller peaks (the shoulders) on either side. Traders can use this pattern to enter short positions in the asset.
  3. Double Bottom Pattern: The double bottom pattern is a bullish reversal pattern that is formed after a downtrend. This pattern is characterized by two consecutive bottoms at the same level. Traders can use this pattern to enter long positions in the asset.

How to use moving averages to confirm the ascending triangle pattern?

Moving averages are one of the most commonly used technical indicators to confirm the analysis of the ascending triangle pattern. Moving averages are calculated by taking the average price of an asset over a specific period, and they are used to identify the direction of the trend.

To use moving averages to confirm the ascending triangle pattern, traders typically use two types of moving averages: the simple moving average (SMA) and the exponential moving average (EMA).

The SMA is calculated by taking the average price of an asset over a specific period, such as 50 or 200 days. The EMA is similar, but it gives more weight to recent price action, making it a more responsive indicator.

To confirm the analysis of the ascending triangle pattern using moving averages, traders typically look for the following:

  1. The price of the asset should be trading above the moving average. This indicates that the asset is in an uptrend, which is consistent with the bullish nature of the ascending triangle pattern.
  2. The moving average should be sloping upward. This indicates that the trend is gaining strength, which is also consistent with the bullish nature of the ascending triangle pattern.
  3. The price should be trading above the moving average during the formation of the ascending triangle pattern. This indicates that the buyers are in control, and the trend is likely to continue higher.
  4. When the price breaks above the resistance level of the ascending triangle pattern, the moving average should continue to slope upward, indicating that the trend is gaining strength.

By using moving averages to confirm the analysis of the ascending triangle pattern, traders can potentially increase the accuracy of their trades and reduce their risk. However, it is important to note that no technical indicator is 100% accurate, and traders should always use proper risk management techniques and have a clear trading plan in place before entering any position in the financial markets.

Examples of Ascending Triangle Patterns

Let’s explore a few examples of how the ascending triangle pattern has played out in the financial markets.

Example 1: Bitcoin (BTC/USD)

In early 2021, Bitcoin was forming an ascending triangle pattern on the daily chart. The pattern was characterized by a horizontal resistance level at $42,000 and a series of higher lows. As the pattern formed, trading volume increased, indicating a growing interest in the asset.

On September 7, 2021, Bitcoin broke above the resistance level, accompanied by high trading volume. Traders who entered a long position at the breakout enjoyed a significant profit as Bitcoin continued to rally higher.

Example 2: Apple Inc. (AAPL)

In early 2021, Apple Inc. was forming an ascending triangle pattern on the daily chart. The pattern was characterized by a horizontal resistance level at $140 and a series of higher lows. As the pattern formed, trading volume increased, indicating a growing interest in the stock.

On January 26, 2021, Apple broke above the resistance level, accompanied by high trading volume. Traders who entered a long position at the breakout enjoyed a significant profit as the stock continued to rally higher.

Example 3: Gold (XAU/USD)

In early 2021, Gold was forming an ascending triangle pattern on the daily chart. The pattern was characterized by a horizontal resistance level at $1,900 and a series of higher lows. As the pattern formed, trading volume increased, indicating a growing interest in the asset.

On January 6, 2021, Gold broke above the resistance level, accompanied by high trading volume. Traders who entered a long position at the breakout enjoyed a significant profit as Gold continued to rally higher.

In conclusion

The ascending triangle pattern is a powerful bullish pattern that can provide valuable insights into future price movements. Traders who can identify this pattern and trade it effectively can potentially outperform the market.

To trade the ascending triangle pattern effectively, traders should wait for the breakout above the resistance level before entering a long position. The breakout should be accompanied by high trading volume to confirm the strength of the trend. Traders should also be aware of false breakouts and wait for a close above the resistance level before entering a long position.

As always, traders should use proper risk management techniques and have a clear trading plan in place before entering any position in the financial markets.

Maximizing Your Portfolio with the Wheel Strategy

The Wheel Strategy is a simple and effective options trading strategy that can be a great way to generate consistent income and potentially buy stocks at a discount.

Investing in the stock market can be a risky and complex endeavor, but it is also a great way to grow your wealth over time. One popular strategy for maximizing returns on your portfolio is called the Wheel Strategy.

The Wheel Strategy is a simple and effective options trading strategy that involves selling cash-secured puts on stocks you want to own and then selling covered calls on those same stocks once you own them. This approach can be a great way to generate consistent income and potentially buy stocks at a discount.

You can also read: The Power of Descending Triangle Patterns in Financial Markets

Introduction to the Wheel Strategy

The Wheel Strategy is a popular options trading strategy that can be used to generate consistent income and potentially buy stocks at a discount. This strategy involves selling cash-secured puts on a stock you want to own and then selling covered calls on that same stock once you own it.

The first step in implementing the Wheel Strategy is to choose a stock that you are bullish on and that has options available. You then sell a cash-secured put with a strike price that is lower than the current stock price. If the stock price does not drop below the strike price of the put, you keep the premium you collected when you sold the put. If the stock price does drop below the strike price of the put, you are required to buy the stock at the strike price.

If you are assigned the stock, you then sell a covered call with a strike price that is higher than the current stock price. If the stock price does not rise above the strike price of the call, you keep the premium you collected when you sold the call. If the stock price does rise above the strike price of the call, you are required to sell the stock at the strike price.

The process then repeats itself. If the call option is exercised and you are required to sell the stock, you can choose a new stock and sell a cash-secured put on that stock. If the call option expires worthless, you can sell another covered call on the same stock.

The key to success with the Wheel Strategy is to be patient and selective. You should choose stocks that you are confident will perform well over the long-term and that meet your criteria for implied volatility, dividend payments, and other factors. You should also be patient and not be discouraged if you don’t collect premiums every month.

In addition to the Wheel Strategy, there are other options trading strategies that you can consider. The covered call strategy, iron condor strategy, and straddle strategy are all popular alternatives. However, each of these strategies has its own advantages and disadvantages, so it is important to do your research and choose the strategy that best fits your investment goals and risk tolerance.

Benefits of the Wheel Strategy

One of the biggest benefits of the Wheel Strategy is its ability to generate consistent income. By selling cash-secured puts, you can collect premiums upfront for agreeing to potentially buy a stock at a certain price. If the stock doesn’t drop below that price, you keep the premium and can sell another put. If the stock does drop below that price, you buy the stock at a discount and can then sell covered calls on it to generate even more income.

Another benefit of the Wheel Strategy is its flexibility. You can implement this strategy on any stock that has options available, and it can be adjusted to suit your risk tolerance and investment goals. For example, you can choose to sell puts with a strike price that is closer or further away from the current stock price, depending on how bullish or bearish you are on the stock.

Lastly, the Wheel Strategy can be a great way to potentially buy stocks at a discount. By selling puts at a lower strike price, you can potentially buy a stock at a lower price than what it is currently trading at. If you then sell covered calls on that stock, you can potentially sell it at a higher price than what you paid for it, generating a profit.

How to Implement the Wheel Strategy?

Implementing the Wheel Strategy is relatively simple, but there are a few key steps you need to follow:

Step 1: Choose a stock you want to own

The first step in implementing the Wheel Strategy is to choose a stock you want to own. You should choose a stock that you are bullish on and that you believe has long-term potential. You should also choose a stock that has options available, as you will be selling puts and covered calls on that stock.

Step 2: Sell a cash-secured put

Once you have chosen a stock, the next step is to sell a cash-secured put. This involves selling a put option with a strike price that is lower than the current stock price. By selling a put option, you are agreeing to potentially buy the stock at the strike price if it falls below that price. To sell a cash-secured put, you will need to have enough cash in your account to buy the stock if it is put to you.

Step 3: Wait for the put to expire

After you have sold the put, you will need to wait for the option to expire. If the stock price remains above the strike price of the put, the option will expire worthless and you will keep the premium you collected when you sold the put. If the stock price falls below the strike price of the put, the option will be exercised and you will be required to buy the stock at the strike price.

Step 4: Sell a covered call

If the put option is exercised and you are assigned the stock, the next step is to sell a covered call. This involves selling a call option with a strike price that is higher than the current stock price. By selling a call option, you are agreeing to potentially sell the stock at the strike price if it rises above that price. If the stock price does not rise above the strike price, the option will expire worthless and you will keep the premium you collected when you sold the call.

Step 5: Repeat the process

If the call option expires worthless, you can repeat the process by selling another cash-secured put on the same stock. If the call option is exercised and you are required to sell the stock, you can repeat the process by choosing a new stock and selling a cash-secured put on that stock.

Strategies for Choosing Stocks for Your Portfolio

Choosing the right stocks for your portfolio is an important part of implementing the Wheel Strategy. Here are a few strategies for choosing stocks:

Strategy 1: Choose stocks you are bullish on

The first strategy for choosing stocks is to choose stocks that you are bullish on. These are stocks that you believe have long-term potential and that you would be happy to own even if the Wheel Strategy doesn’t work out.

Strategy 2: Choose stocks with high implied volatility

Another strategy for choosing stocks is to choose stocks with high implied volatility. Implied volatility is a measure of how much the market expects a stock’s price to fluctuate in the future. Stocks with high implied volatility will typically have higher option premiums, which means you can collect more income when selling puts and covered calls.

Strategy 3: Choose stocks with dividends

Finally, you can choose stocks with dividends. These are stocks that pay a regular dividend to shareholders, which can provide additional income on top of the premiums you collect from selling puts and covered calls. Dividend-paying stocks can also be more stable and less volatile than non-dividend-paying stocks, which can make them a good choice for the Wheel Strategy.

Tips and Tricks for Maximizing Returns

Here are a few tips and tricks for maximizing returns with the Wheel Strategy:

Tip 1: Be patient

One of the keys to success with the Wheel Strategy is to be patient. You may not collect premiums every month, and it may take some time for the strategy to start generating consistent income. However, if you stick with it and continue to sell puts and covered calls, you can potentially generate significant returns over time.

Tip 2: Be selective

Another tip for maximizing returns is to be selective when choosing stocks. Don’t just sell puts and covered calls on any stock that has options available. Instead, choose stocks that you are bullish on and that meet your criteria for implied volatility, dividend payments, and other factors.

Tip 3: Use technical analysis

Technical analysis can be a useful tool for identifying potential entry and exit points for stocks. By analyzing charts and technical indicators, you can potentially identify support and resistance levels for stocks, which can help you choose strike prices for puts and covered calls.

Tip 4: Consider rolling options

If a put option is exercised and you are required to buy the stock, you can consider rolling the option. This involves buying back the option and then selling a new option with a later expiration date and a higher strike price. By rolling the option, you can potentially generate more income and buy the stock at a lower price.

Alternatives to the Wheel Strategy

While the Wheel Strategy can be an effective way to generate consistent income and potentially buy stocks at a discount, it is not the only options trading strategy available. Here are a few alternatives to consider:

Alternative 1: Covered call strategy

The covered call strategy is similar to the Wheel Strategy, but instead of selling cash-secured puts, you simply buy the stock and then sell covered calls on it. This strategy can be a good choice if you are already bullish on a stock and want to generate additional income from it.

Alternative 2: Iron condor strategy

The iron condor strategy involves selling both a put and a call option on a stock at the same time, with strike prices that are further away from the current stock price. This strategy can potentially generate income in a range-bound market, but can also be riskier than the Wheel Strategy.

Alternative 3: Straddle strategy

The straddle strategy involves buying both a put and a call option on a stock at the same time, with strike prices that are close to the current stock price. This strategy can potentially generate significant profits if the stock price moves significantly in either direction, but can also be riskier than the Wheel Strategy.

In conclusion

The Wheel Strategy is a simple and effective options trading strategy that can be a great way to generate consistent income and potentially buy stocks at a discount. By selling cash-secured puts and covered calls, you can potentially generate significant returns over time. However, it is important to be patient, selective, and to use technical analysis to maximize your returns. And while the Wheel Strategy is a great choice for many investors, there are also alternative options trading strategies to consider depending on your investment goals and risk tolerance.

The Power of Descending Triangle Patterns in Financial Markets

The descending triangle pattern is a powerful bearish chart pattern that can be used by traders to generate trading signals.

Technical analysis is a popular method used by traders to analyze financial markets. One of the key tools used in technical analysis is chart patterns. Chart patterns are formed by the price action of an asset over time and can be used to identify potential trading opportunities. The descending triangle pattern is one of the most powerful chart patterns in financial markets. In this guide, we will explore the characteristics of the descending triangle pattern, its formation, and how traders can use it to generate trading signals.

You can also read: What is HNT (Helium) and How Does it Work?

What is a Descending Triangle Pattern?

A descending triangle pattern is a bearish chart pattern that is formed by a series of lower highs and a horizontal support level. The pattern is characterized by a series of lower highs that form a descending trendline and a horizontal support level that forms the base of the triangle. The descending triangle pattern is considered a bearish pattern because it suggests that sellers are gradually gaining control of the market, and the price is likely to continue to move lower.

Identifying a Descending Triangle Pattern

A descending triangle pattern is formed when the price of an asset is making a series of lower highs and is unable to break through a horizontal support level. Traders will typically look for at least two points of contact with the support level to confirm that it is a valid level of support. As the price continues to make lower highs, it creates a descending trendline that converges with the horizontal support line to form the triangle pattern.

When the price breaks below the support level, it is considered a bearish signal, and traders may look to enter short positions or sell their long positions. The target for the trade is typically the height of the triangle pattern measured from the support level to the highest point of the descending trendline.

Key Characteristics of a Descending Triangle Pattern

There are several key characteristics of a descending triangle pattern that traders should be aware of:

  1. Lower Highs: The pattern is characterized by a series of lower highs that form a descending trendline.
  2. Horizontal Support Level: The pattern is formed by a horizontal support level that acts as the base of the triangle.
  3. Converging Trendlines: The descending trendline and the horizontal support level converge to form the triangle pattern.
  4. Bearish Signal: When the price breaks below the support level, it is considered a bearish signal, and traders may look to enter short positions or sell their long positions.
  5. Target for the Trade: The target for the trade is typically the height of the triangle pattern measured from the support level to the highest point of the descending trendline.

Strategies for Trading with a Descending Triangle Pattern

A descending triangle pattern is a bearish chart pattern that can be used by traders to identify potential selling opportunities. It is formed by a horizontal support level and a series of lower highs that form a descending trendline. In this guide, we will explore some strategies for trading with a descending triangle pattern.

Identifying a Descending Triangle Pattern

The first step in trading with a descending triangle pattern is to identify the pattern. Traders should look for a horizontal support level that has been tested at least twice and a series of lower highs that form a descending trendline. The descending trendline should be sloping downwards and should be parallel to the horizontal support level. Once the pattern has been identified, traders can look for potential selling opportunities.

Strategy 1: Breakout Trading

One strategy for trading with a descending triangle pattern is breakout trading. Breakout trading involves waiting for the price to break below the horizontal support level before entering a short position. When the price breaks below the support level, it is considered a bearish signal, and the price is likely to continue to move lower.

Traders should wait for the price to close below the support level before entering a short position. They should also place a stop loss above the descending trendline to limit their losses in case the price moves against them.

The profit target for the trade can be determined by measuring the height of the triangle pattern and subtracting it from the breakout point. This will give traders an idea of how far the price may move after the breakout.

Strategy 2: Pullback Trading

Another strategy for trading with a descending triangle pattern is pullback trading. Pullback trading involves waiting for the price to pull back to the descending trendline before entering a short position. When the price pulls back to the trendline, it is considered a selling opportunity, and the price is likely to continue to move lower.

Traders should wait for the price to touch or come close to the descending trendline before entering a short position. They should also place a stop loss above the descending trendline to limit their losses in case the price moves against them.

The profit target for the trade can be determined by measuring the height of the triangle pattern and subtracting it from the entry point. This will give traders an idea of how far the price may move after the pullback.

Strategy 3: Moving Average Crossover

Another strategy for trading with a descending triangle pattern is the moving average crossover. This strategy involves using two moving averages of different periods to generate buy and sell signals.

Traders can use a shorter-term moving average, such as a 10-day moving average, and a longer-term moving average, such as a 50-day moving average. When the shorter-term moving average crosses below the longer-term moving average, it is considered a bearish signal, and traders may look to enter a short position. When the shorter-term moving average crosses above the longer-term moving average, it is considered a bullish signal, and traders may look to exit their short position or enter a long position.

Traders should also look for the descending triangle pattern to confirm the sell signal. When the price breaks below the support level, it confirms the bearish signal generated by the moving average crossover.

Benefits of Using an Ascending Triangle Pattern

  1. Easy to Identify: The descending triangle pattern is easy to identify and can be used by traders of all levels.
  2. High Probability: The descending triangle pattern has a high probability of success, as it is a reliable bearish pattern.
  3. Clear Entry and Exit Signals: The pattern provides clear entry and exit signals, making it easier for traders to manage their trades.
  4. Defined Risk and Reward: The pattern provides traders with a defined level of risk and reward, making it easier to manage their trades.

Drawbacks of Trading the Descending Triangle Pattern

  1. False Signals: Like all chart patterns, the descending triangle pattern can produce false signals, which can result in losses for traders.
  2. Limited Timeframe: The pattern is a short-term pattern and may not be suitable for traders who prefer longer-term trading strategies.
  3. Limited Profit Potential: The profit potential for the trade is limited to the height of the triangle pattern measured from the support level to the highest point of the descending trendline.

In conclusion

The descending triangle pattern is a powerful bearish chart pattern that can be used by traders to generate trading signals. The pattern is characterized by a series of lower highs and a horizontal support level that converges to form a triangle pattern. When the price breaks below the support level, it is considered a bearish signal, and traders may look to enter short positions or sell their long positions. The target for the trade is typically the height of the triangle pattern measured from the support level to the highest point of the descending trendline. While the pattern has its advantages and disadvantages, it is a reliable pattern that can be used by traders of all levels to identify potential trading opportunities.

What is HNT (Helium) and How Does it Work?

Human Networking Technology (HNT) is a powerful tool that can help businesses streamline their processes and increase efficiency. To see and read more, follow our blogs.

Have you heard of HNT yet? If not, get ready to discover the world of this revolutionary technology that’s changing the game for IoT devices and networks. HNT stands for Helium Network Token, and it’s a cutting-edge cryptocurrency that’s taking the tech world by storm. But what exactly is HNT, and how does it work? In this blog post, we’ll dive into everything you need to know about this exciting new development in tech. From its unique blockchain-based system to its potential to transform industries like healthcare and agriculture, we’ll explore all aspects of HNT and why it’s worth paying attention to in 2021. So strap in and get ready to learn about one of the most fascinating innovations on the horizon!

You can also read: Unpacking the Future of VeChain: Predictions for 2024

Introduction to HNT

If you’re new to the world of HNT, or “Human Needs Testing,” then this introduction is for you. HNT is a powerful tool that can help you assess your product or service’s appeal to customers. It allows you to see whether or not people actually want or need what you’re offering.

There are a few different ways to conduct HNT, but the basic premise is always the same: put your potential customers in a situation where they need to use your product or service, and see how they react. This can be done through in-person testing, online surveys, or even by simply observing people’s behavior in real-world situations.

The key is to make sure that your test subjects are representative of your target market; otherwise, you won’t be able to accurately gauge whether or not your product has real-world appeal. Once you have your test subjects lined up, it’s time to start collecting data.

HNT can tell you a lot about how people interact with your product or service, and whether or not they actually find it useful. It’s an essential tool for any business that wants to ensure its products and services are truly meeting customer needs.

What is HNT and How Does it Work?

HNT, or Human Nature Technology, is a new type of technology that harnesses the power of human nature to create sustainable energy. This unique form of renewable energy is created by using the natural movements of people to generate electricity. HNT is environmentally friendly and does not produce any harmful emissions. Additionally, HNT is a cost-effective way to generate energy, as it does not require any expensive equipment or infrastructure.

Benefits of Using HNT

HNT, or Human Needs Therapy, is a type of therapy that focuses on meeting the basic needs of humans in order to help them heal emotionally and mentally. This type of therapy can be beneficial for anyone, but it is especially helpful for those who have experienced trauma or who are struggling with mental illness. HNT can provide relief from symptoms of anxiety, depression, and stress, as well as help people to cope with and recover from traumatic events.

The Hotspot Network and HNT Rewards

The Hotspot Network is a decentralized network of individuals and organizations that provides free, high-quality Internet access to its users. The Hotspot Network is funded by advertisements and donations from its users. Users who donate to the Hotspot Network are rewarded with HNT tokens.

HNT tokens can be used to purchase goods and services on the Hotspot Network or exchanged for other cryptocurrencies. HNT tokens can also be used to vote on proposals to improve the Hotspot Network.

How to Earn HNT?

There are a few different ways to earn HNT. The most common way is through the Helium app, which allows users to share their data connection with the Helium network in exchange for HNT tokens. Other ways to earn HNT include becoming a validator or working on the Helium development team. 

The Helium app is available for both Android and iOS devices, and can be downloaded from the Google Play Store or the Apple App Store. Once installed, open the app and sign up for an account. After your account has been created, you’ll be able to start sharing your data connection with the Helium network and earning HNT tokens in return. 

Validators play an important role in maintaining the security of the Helium network, and as such they are rewarded with HNT tokens. If you’re interested in becoming a validator, you can learn more about it on the Helium website. 

Those who work on developing the Helium network can also earn HNT tokens. If you’re a developer interested in working on Helium, you can get started by joining the helium-discuss mailing list and introduce yourself to the community.

Safety & Security with HNT

HNT tokens are backed by a reserve of real-world assets, making them more stable than other cryptocurrencies. HNT is also the world’s first cryptocurrency to offer instant transactions and decentralized KYC/AML compliance.

HNT’s security is based on a multi-layered approach that includes both traditional centralized security measures as well as decentralized solutions. Centralized security measures include things like 2FA and IP whitelisting, while decentralized solutions include HNT’s unique Proof-of-Stake algorithm and HNT Lockboxes.

The combination of centralized and decentralized security measures makes HNT one of the most secure cryptocurrencies in the world. Additionally, HNT has a dedicated team of security experts who are constantly working to identify and mitigate potential threats.

Alternatives to Earning HNT

There are a few different ways to earn HNT. The most popular method is through the Helium app, which allows users to earn HNT by participating in the Helium network and completing various tasks. However, there are a few other ways to earn HNT, such as:

  • Completing surveys on the Helium website
  • Participating in Helium Twitter campaigns
  • Referring new users to the Helium network

Conclusion

Human Networking Technology (HNT) is a powerful tool that can help businesses streamline their processes and increase efficiency. It allows users to connect with each other in ways never before thought possible, providing the ability to communicate quickly and effectively. With HNT, companies are able to reduce costs associated with traditional networking methods while maximizing productivity. We hope this article has provided you with a better understanding of what HNT is and how it works so you can make an informed decision on whether or not it’s right for your business.

Unpacking the Future of VeChain: Predictions for 2024

As the VeChain technology continues to develop, it is likely that its usage and applications will only become more widespread in the years ahead.

Welcome to the exciting world of VeChain, where blockchain technology meets supply chain management. As one of the most promising players in this rapidly evolving space, VeChain has been making waves with its innovative solutions that promise to revolutionize industries ranging from healthcare and logistics to food safety and luxury goods. But what does the future hold for this dynamic platform? In this blog post, we will dive deep into our crystal ball and unpack some predictions for the year 2024, giving you a glimpse of what lies ahead for VeChain and its community of investors, developers, partners, and users. So fasten your seatbelts as we explore the potential pathways that could shape the destiny of VeChain over the next few years!

You can also read: The benefits of using Jasmycoin as a native token on the Jasmy network

Introduction to VeChain

In 2009, Satoshi Nakamoto released the Bitcoin white paper, which outlined a new Peer-to-Peer Electronic Cash System. This system was powered by a decentralized ledger of transaction records, which were secured through cryptography. Bitcoin quickly became the first and most successful cryptocurrency, with a market capitalization that continues to grow today.

However, Bitcoin is not without its flaws. One major issue is the slow speed of transactions, which can take up to 10 minutes to be confirmed. Another is the lack of privacy, as all transactions are publically visible on the blockchain.

Enter VeChain, a blockchain platform that promises to solve these issues and more. VeChain aims to create a “trusted distributed ecosystem” that is transparent, secure, and efficient. In this article, we will explore VeChain’s features and predictions for its future.

Overview of VeChain’s Performance in the Past

VeChain’s performance in the past can be described as impressive, but with room for improvement. The company has shown a continuous commitment to improving their product and expanding their user base. Here is a detailed overview of VeChain’s performance in the past:

2015

VeChain launched their first product, a blockchain-based anti-counterfeiting solution that helps brands protect their products from counterfeiters.

2016

VeChain expanded their product offerings to include a supply chain management solution that helps businesses track and manage their inventory.

2017

VeChain launched their mainnet, which allows businesses to build decentralized applications on top of the VeChain platform.

2018

VeChain introduced several new features and products, including a partnership with DNV GL to launch a food safety solution, and the launch of their enterprise blockchain platform, VechainThor.

Drivers of VeChain’s Growth

VeChain is a public blockchain platform that focuses on bringing blockchain technology to businesses and industries. The VeChain platform is designed to create a trust-free and distributed business ecosystem that is transparent, efficient, and secure. The native currency of the VeChain platform is VET, which is used to power the smart contracts and applications on the network.

The VeChain team has partnerships with some of the largest companies in the world, such as PwC, DNV GL, Renault Group, and Microsoft. These partnerships are important for the growth of VeChain because they help to promote the use of blockchain technology in real-world applications. Moreover, these companies are also working on developing new applications on top of the VeChain platform.

In addition to its partnerships, VeChain has also been working on various initiatives to promote the adoption of its platform. For instance, VeChain launched its Foundation Center in 2018 which is dedicated to supporting education and training programs around blockchain technology. The Foundation Center offers resources such as online courses, workshops, and hackathons that aim to help people learn about blockchain technology and how to build applications on top ofVeChain’s public blockchain platform.

Vechain Price predictions 2024

In 2024, VeChain will be a major player in the global supply chain and logistics industry. The company’s blockchain technology will help to streamline supply chains and make them more efficient. Additionally, VeChain will partner with major corporations to help them track their products and ensure quality control.

Minimum Price Prediction

The minimum price prediction for VeChain is $0.004 per coin. This price point is achievable within the next two years and would give VeChain a total market capitalization of $40 million. At this price point, VeChain would still be considered a small-cap cryptocurrency but would have significant room to grow. This prediction is based on the current trends in the cryptocurrency market and the potential for VeChain to become a leading platform for enterprise applications.

Maximum Price Prediction

As the saying goes, “a rising tide lifts all boats.” The same can be said for cryptocurrency prices. When the market is on an upswing, almost every crypto asset experiences price growth. This was certainly the case in 2017, when Bitcoin surged to nearly $20,000 and altcoins like Ethereum, Litecoin, and Monero saw exponential gains as well.

With this in mind, it’s important to remember that past performance is not indicative of future results. Just because a particular asset did well in the past doesn’t mean it will continue to do so. So, what can we expect from VeChain in the future?

VeChain is a blockchain platform that’s designed for enterprises. It offers a number of features and benefits that make it attractive to businesses, which is one reason why its price has increased so much since its launch in 2015. Here’s a look at some predictions for VeChain’s future price growth:

Bullish Predictions ($1000+ by 2023)

The most bullish predictions for VeChain come from those who think the coin has the potential to reach prices above $1000 in the next few years. This is based on the idea that VeChain will become widely adopted by businesses and governments, leading to increased demand for the coin and higher prices as a result.

Other Factors That May Influence VeChain’s Future Value

In addition to the potential applications and partnerships discussed above, there are a number of other factors that could have a positive impact on VeChain’s future value.

For example, the team behind VeChain is continuing to make progress on their roadmap, with new features and improvements being released on a regular basis. This not only makes the platform more appealing to potential users, but also helps to build trust and confidence in the team’s ability to execute on their vision.

Furthermore, VeChain has been working hard to establish itself as a leader in the blockchain space, with a strong presence at industry events and a growing community of supporters. This increased visibility could lead to more businesses and individuals taking an interest in the platform, which would in turn drive up demand and price. 

Finally, VeChain has also been working to build relationships with other blockchain projects. By partnering with other players in the space, VeChain can tap into a larger user base and benefit from the collective knowledge and expertise of multiple teams. This could prove to be hugely beneficial for the project in terms of both user growth and development.

Conclusion

As the VeChain technology continues to develop, it is likely that its usage and applications will only become more widespread in the years ahead. With a focus on solving real-world problems through blockchain-backed solutions, VeChain looks set to revolutionize industries across multiple sectors. By 2024, we can expect that Vechain will be well established as one of the leading blockchain projects in the world and largely relied upon for secure and transparent data management systems.

The benefits of using Jasmycoin as a native token on the Jasmy network

In conclusion, JasmyCoin is the perfect native token for the Jasmy network. With its low transaction cost, increased scalability and fast transactions.

Cryptocurrencies have taken the financial world by storm, with hundreds of digital coins and tokens making their way into the market. However, not all cryptocurrencies are created equal. Some offer unique benefits that others simply cannot match. Enter Jasmycoin – a native token on the Jasmy network that is fast becoming one of the most sought-after digital currencies in existence. In this blog post, we’ll explore some of the incredible benefits that come with using Jasmycoin as your go-to cryptocurrency for all your transactions on the Jasmy network. So sit back, relax, and get ready to discover why Jasmycoin might just be the game-changer you’ve been waiting for!

You can also read about EminiFX Review: Legit or Crypto Scam?

What is Jasmycoin?

Jasmycoin is the native token of the Jasmy network. It is used to fuel transactions and smart contracts on the network. Jasmycoin can be used to pay for transaction fees, Gas, and other services on the network. Jasmycoin is also used as a unit of account on the network. 1 Jasmycoin = 1 jasmine (JAS).

How Does Jasmycoin Work on the Jasmy Network?

Jasmycoin is a decentralized cryptocurrency that runs on the Jasmy network. The Jasmy network is a peer-to-peer network of computers that use the Jasmycoin protocol to communicate with each other. Jasmycoin is used as a native token on the Jasmy network and can be used to pay for goods and services, or to exchange value with other users of the network.

Benefits of Using Jasmycoin as a Native Token

As a native token on the Jasmy network, Jasmycoin provides a number of benefits to users.

First, Jasmycoin is fully integrated with the Jasmy network, meaning that it can be used to pay for transaction fees and to access all of the network’s features and services.

Second, Jasmycoin is deflationary, meaning that its supply will decrease over time as more tokens are burned. This makes it an ideal store of value and an attractive investment option.

Third, Jasmycoin has a built-in governance system that allows holders to vote on proposals and make decisions about the future of the network. This ensures that the community remains in control of the platform and that its development is aligned with users’ needs and preferences.

Fourth, Jasmycoin is backed by a reserve fund that protects against volatility and ensures that holders always have access to liquidity. This fund also allows for network expansion and development by providing resources for new projects and initiatives.

Jasmycoin holders receive exclusive discounts and benefits from participating merchants, making it even more advantageous to hold and use the token.

Advantages of Transactions with Jasmycoin

There are several advantages to using Jasmycoin as a native token on the Jasmy network. First, it allows for fast and inexpensive transactions. Second, it is a more secure way to transact than traditional methods such as credit cards or PayPal. Third, it offers users the ability to hold and use their tokens without having to go through a third party exchange. It provides users with a simple and convenient way to keep track of their transaction history.

Security of the Jasmy Network and Transactions with Jasmycoin

The Jasmy network is a secure, decentralized platform that enables fast, low-cost payments for Jasmycoin holders. Transactions on the Jasmy network are verified and recorded on a public blockchain, ensuring transparency and security.

Jasmycoin holders can use their coins to pay for goods and services on the Jasmy network, or to send money to friends and family. Payments are made instantly and can be processed without fees.

To ensure the security of the Jasmy network, all transactions are verified by a consensus of nodes run by independent users. This ensures that no single user can tamper with the transaction history.

Jasmycoin holders can also take advantage of the coin’s built-in smart contract functionality to create contracts that enforce themselves automatically. This allows for trustless agreements between parties, further increasing the security of the Jasmy network.

Conclusion

In conclusion, JasmyCoin is the perfect native token for the Jasmy network. With its low transaction cost, increased scalability and fast transactions, it provides users with a secure and efficient way to make payments on the network. Moreover, due to its decentralized nature, it allows users to remain anonymous while using the network. This makes it an ideal choice for those looking for privacy as well as convenience when making digital payments.

Exit mobile version